


We have all been there. It is 2 AM, a PagerDuty alert screams, and you are staring at a dashboard where latency has gone vertical. The system, once a purring engine, is now a sputtering mess. Was it a bad deploy? A rogue Celery task? A database query that decided to tour your entire dataset? This is the moment every engineer at a growing startup dreads. It is not just a bug; it is a black box. You need visibility, not just logs. I have spent countless nights in that exact darkness, and this article is the map I wish I had. It is my practical guide to choosing from the best application performance monitoring tools without getting lost in marketing speak.
We are about to embark on a journey. We will explore 12 powerful options, from comprehensive platforms like Datadog and New Relic to developer first tools like Sentry and cloud native solutions from AWS and Google Cloud. I will look at each one through the lens of a startup building with tools like Django, Celery, and Docker, focusing on what truly matters: quick instrumentation, actionable insights, and a pricing model that will not bankrupt you before your next funding round.
This guide is designed to be a definitive resource. For each tool, you will find a detailed breakdown of its core features, pros and cons from real world usage, pricing structures, and specific implementation tips for your stack. We will also include screenshots and direct links to help you evaluate each option quickly. Choosing the right tool is only half the battle; implementing it effectively is crucial. For a comprehensive understanding of effective strategies, consider reviewing these best practices for application monitoring before we go deeper. Our goal is to equip you with the knowledge to select and implement an APM solution that turns your production black box into a transparent, observable system.
1. Datadog – Application performance monitoring
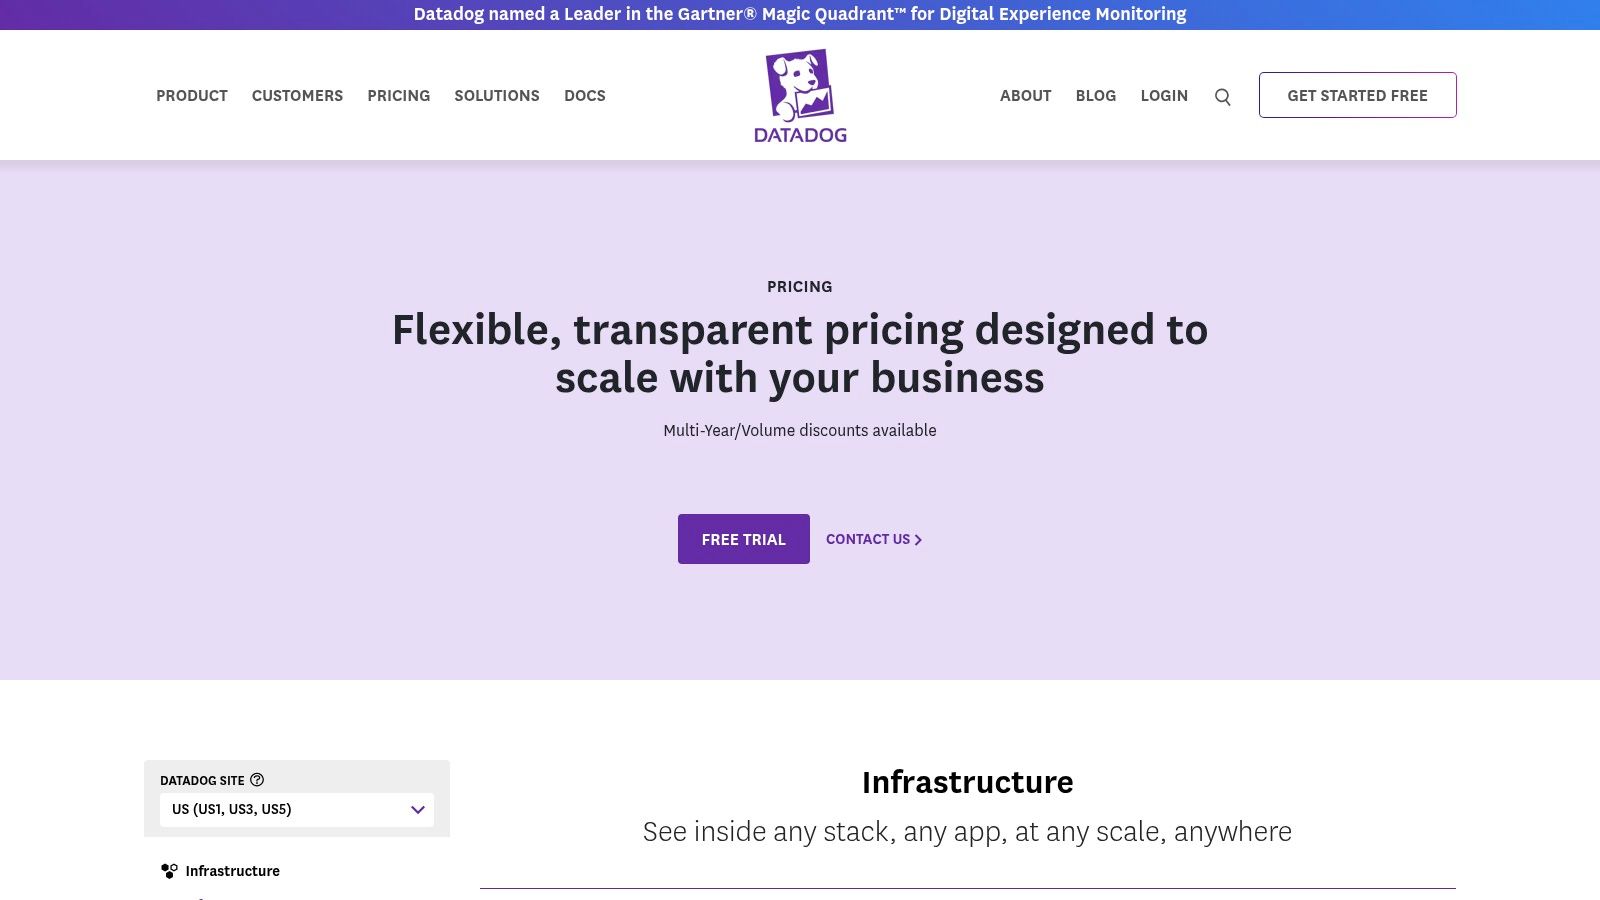
Datadog is a comprehensive, full stack observability platform that has become a dominant player in the world of application performance monitoring tools. It stands out by unifying APM, infrastructure monitoring, log management, real user monitoring (RUM), and security into a single, cohesive SaaS product. This unified approach is particularly powerful for teams managing complex, cloud native stacks, as it eliminates the friction of switching between disparate tools to correlate issues. I remember one incident where we pivoted from a high latency trace in our Django application directly to the underlying container metrics and the relevant error logs from our Celery workers, all in one UI. That moment was a game changer.
The user experience is slick, with well designed dashboards and intuitive navigation that help new teams get up and running quickly. Datadog's extensive integration ecosystem, which includes first class support for AWS, GCP, Azure, and OpenTelemetry, is another major selling point.
Pricing & Implementation
Datadog's APM pricing is transparent and published directly on their site, starting at $31 per host per month (billed annually). It is important to note that APM requires the Datadog Infrastructure plan for each host, which adds to the total cost. Costs can scale quickly as you add more hosts or enable advanced modules like the continuous profiler (included in APM Pro and Enterprise tiers). For a startup, this means careful planning is needed to manage expenses as your infrastructure grows.
- Pros: Enormous integration library, excellent UX and out of the box dashboards, clear published pricing.
- Cons: Total cost can escalate with host count and additional modules; APM is dependent on the infrastructure agent.
- Website: https://www.datadoghq.com/pricing/
2. New Relic – APM and Full‑Platform Observability
New Relic offers a compelling alternative in the space of application performance monitoring tools by structuring its entire platform around a usage based pricing model. This approach consolidates APM, infrastructure monitoring, logs, RUM, and synthetics into a single offering, where you primarily pay for the data you ingest and the number of users, rather than per host. This model can be particularly attractive for startups and teams with fluctuating infrastructure, as it removes the complexity and potential surprise costs associated with per server licensing, especially in auto scaling containerized environments.
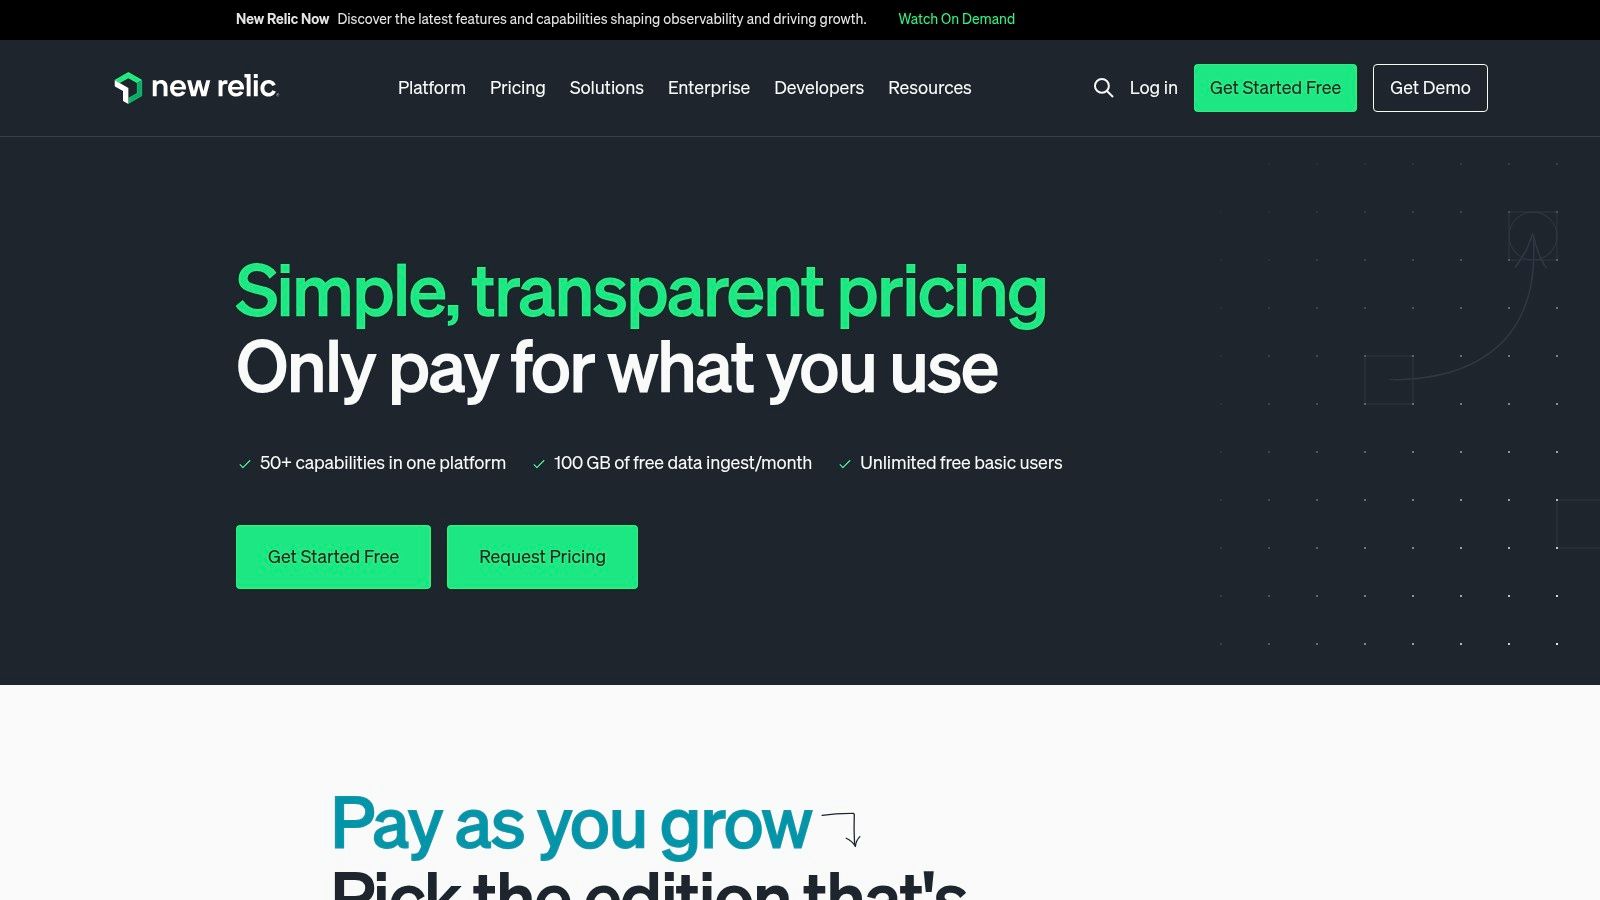
The platform is known for its powerful data exploration tools and a very generous free tier that includes 100 GB of data ingest per month. This allows engineering teams to thoroughly test the platform and even run it in production for smaller workloads without any initial financial commitment. By focusing on data, New Relic encourages a holistic view of system health, which can be a key factor when you learn more about engineering productivity measurement.
Pricing & Implementation
New Relic's pricing is based on two main vectors: data ingested (starting around $0.30/GB) and user seats (Standard, Pro, Enterprise). The free tier is a huge advantage, providing one full platform user and 100 GB of monthly data ingest for free, forever. This simplicity is a major selling point, as you get access to all 50+ capabilities without complex add ons. However, for data intensive applications, teams must be diligent about managing data ingest to avoid unexpected overage fees. Setting up agents for Django or Celery is straightforward with extensive documentation.
- Pros: Generous free tier is perfect for startups, simple usage based pricing model, no per host licensing complexity.
- Cons: Data overage fees can add up if ingest is not carefully managed; advanced features and user controls are tied to more expensive Pro/Enterprise tiers.
- Website: https://newrelic.com/pricing
3. Dynatrace – All‑in‑one APM and AI‑assisted Observability
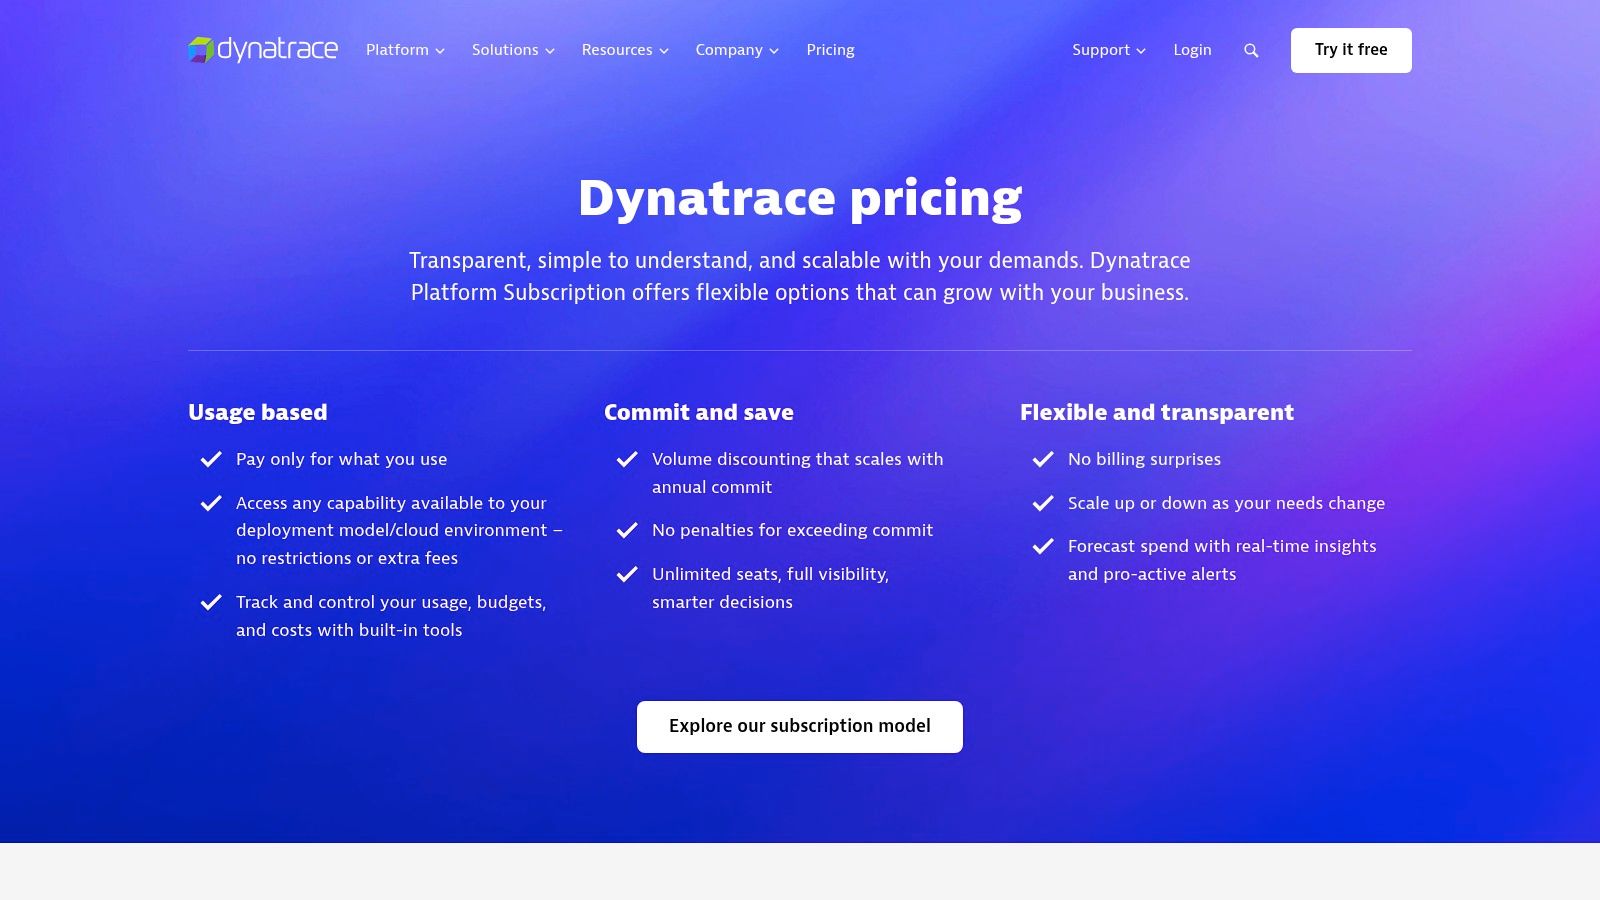
Dynatrace positions itself as a highly automated, AI powered platform among the available application performance monitoring tools. Its core strength lies in its "Davis" AI engine, which goes beyond simple alerting to provide automatic root cause analysis. For teams managing complex microservices architectures, this is a game changer. Dynatrace automatically discovers and maps your entire application topology, from frontend user actions down to the underlying container and cloud infrastructure, creating a dynamic model called Smartscape. This contextual understanding enables the AI to pinpoint the precise source of a problem without manual correlation.
This automated discovery is especially powerful in ephemeral environments like Kubernetes, where manual configuration struggles to keep up. The platform's deep visibility and AI driven insights make it a strong choice for enterprises and startups that prioritize operational efficiency and want to reduce the mean time to resolution (MTTR). It feels a bit like having a junior SRE on your team, constantly watching and connecting the dots for you.
Pricing & Implementation
Dynatrace offers a usage based pricing model that is publicly available on their website, centered around units like "Host Unit hours" and "GiB hours" for memory. This can be more cost effective for applications with fluctuating workloads, but it can also be less predictable than a simple per host model, requiring some initial analysis to forecast costs. Full stack monitoring, which unlocks most of the powerful AI features, is the primary tier. Implementation is streamlined through its OneAgent, which handles auto instrumentation for many technologies, including OpenTelemetry, simplifying the initial setup process for teams.
- Pros: Highly automated discovery and root cause analysis, clear public rate card with hourly pricing granularity, strong Kubernetes and container observability.
- Cons: Memory GiB hour pricing model can be unfamiliar; advanced features often require the full stack tier.
- Website: https://www.dynatrace.com/pricing/
4. Cisco AppDynamics – Enterprise APM
AppDynamics, now part of Cisco, is a major player in the world of application performance monitoring tools, often favored by large enterprises with complex, hybrid environments. It excels at providing deep visibility into business transactions, mapping the entire user journey from a mobile app tap all the way through monolithic backends, SAP systems, and modern cloud native services. This business centric view is its key differentiator, allowing teams to directly correlate application performance with business outcomes like revenue or user conversions.
The platform offers a robust set of features, including infrastructure monitoring, real user monitoring (RUM), and application security add ons, which can be combined to form a comprehensive observability solution. While it supports modern technologies like OpenTelemetry, its traditional strength lies in its agent based instrumentation for established stacks like Java and .NET, making it a go to for organizations modernizing their legacy systems. This focus is critical for ensuring you maintain a high availability architecture that actually works across both old and new infrastructure.
Pricing & Implementation
AppDynamics provides several editions (Infrastructure, Premium, Enterprise) with pricing typically licensed on a per CPU core basis. This model can be advantageous for hosts with low core counts but can become a significant expense for horizontally scaled, dense compute environments common in startups. While specific pricing is often quote based, this approach offers predictability for enterprises managing fixed infrastructure budgets. Implementation involves deploying agents to your hosts or applications, which is a well documented but potentially involved process for large, distributed systems.
- Pros: Strong for traditional enterprise and SAP environments, excellent business transaction mapping, broad DEM and security add on ecosystem.
- Cons: Per core licensing can get expensive at scale, some advanced modules are sold as separate add ons, can feel overly complex for smaller teams.
- Website: https://www.appdynamics.com/pricing
5. Splunk Observability Cloud (incl. Splunk APM)
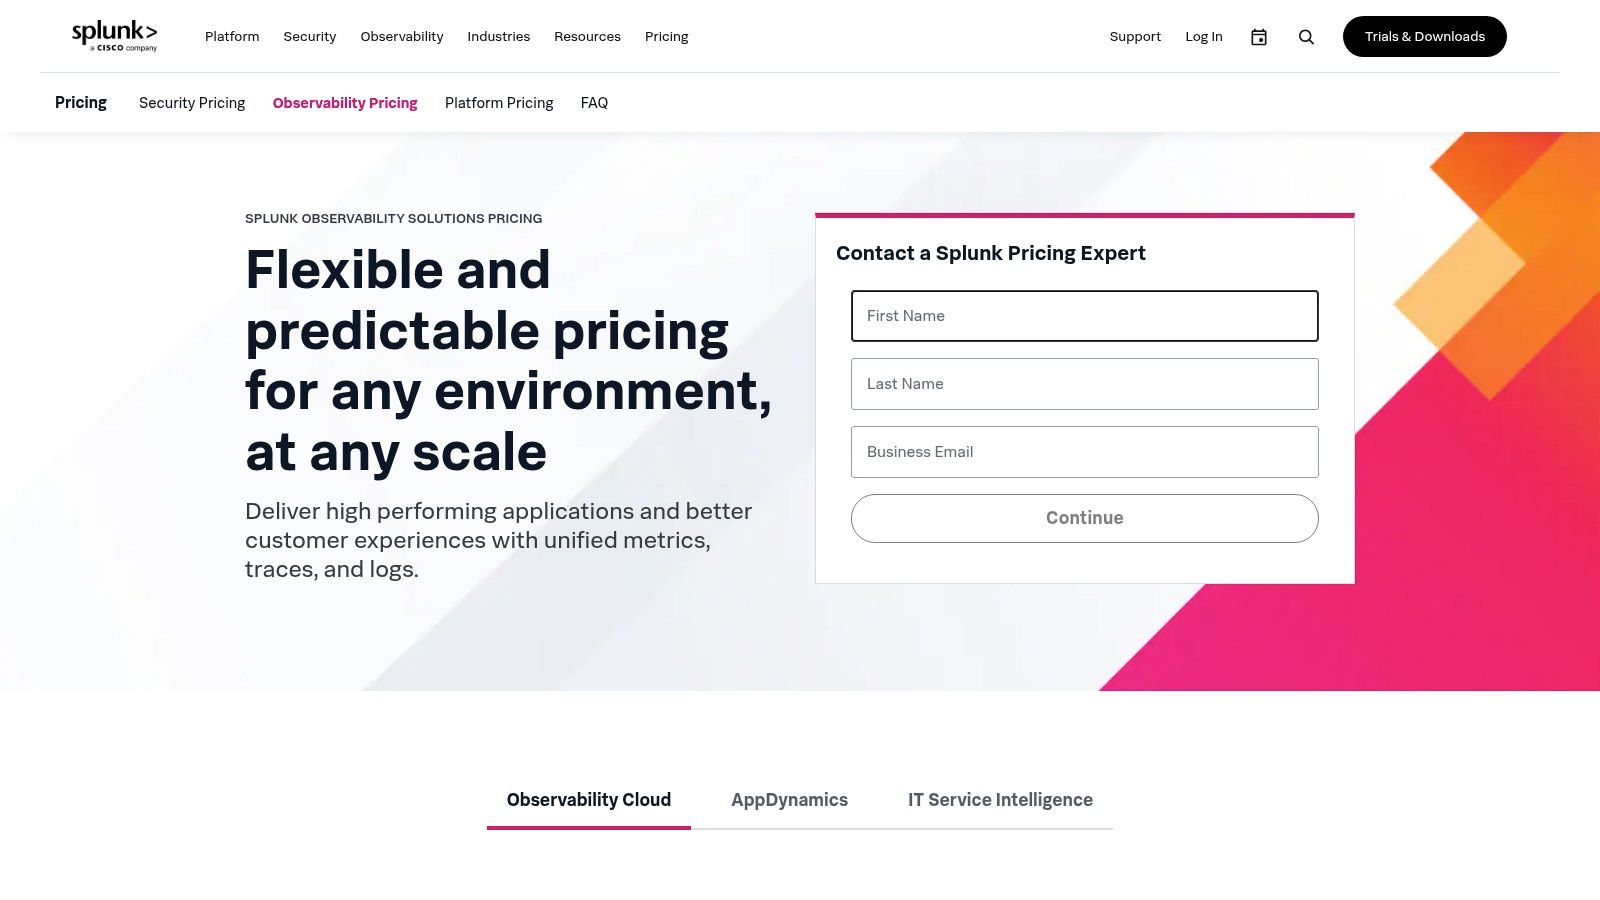
Splunk Observability Cloud offers a powerful suite for engineering teams that prioritize high fidelity, real time data analysis. As one of the more advanced application performance monitoring tools, its key differentiator is a "NoSample" full fidelity tracing approach. This means it ingests and analyzes every single transaction, which is invaluable for debugging intermittent, hard to reproduce bugs in complex distributed systems. I once got stuck on a bug for hours that only appeared for one specific user journey, and this kind of full fidelity view would have been a lifesaver.
This focus on streaming analytics allows for extremely fast alerting on high cardinality data, a common pain point for startups scaling their services. Splunk's deep integration with Kubernetes and major cloud providers ensures it fits well within modern DevOps workflows, providing clarity from the application layer down to the container orchestrator. It is also built around an OpenTelemetry native collection framework, promoting vendor neutrality and future proofing your instrumentation strategy.
Pricing & Implementation
Splunk provides public, module based pricing on its website, allowing teams to assemble the specific observability stack they need. Splunk APM starts at $55 per host per month when billed annually. Like other platforms, you will need to add infrastructure monitoring, which starts at $15 per host per month, to get a complete picture. While this à la carte approach offers flexibility, it requires careful planning to ensure you have full stack visibility without unexpected costs. Startups should note that the best rates are typically for annual commitments.
- Pros: Strong tracing at scale with fast streaming alerts, OpenTelemetry native, good Kubernetes and cloud integration.
- Cons: Separate SKUs must be assembled to build a full stack solution; the best pricing rates require annual billing.
- Website: https://www.splunk.com/en_us/products/pricing/observability.html
6. Elastic – Elastic Observability (Elastic APM) on Elastic Cloud
For teams already invested in the Elastic ecosystem for search or security, leveraging Elastic Observability for APM is a natural and powerful next step. It consolidates logs, metrics, traces, and synthetics into the same familiar Kibana interface, eliminating context switching. This makes it one of the more integrated application performance monitoring tools for organizations looking to unify their data platforms. The OpenTelemetry first approach also ensures it plays well with modern, vendor neutral instrumentation standards.
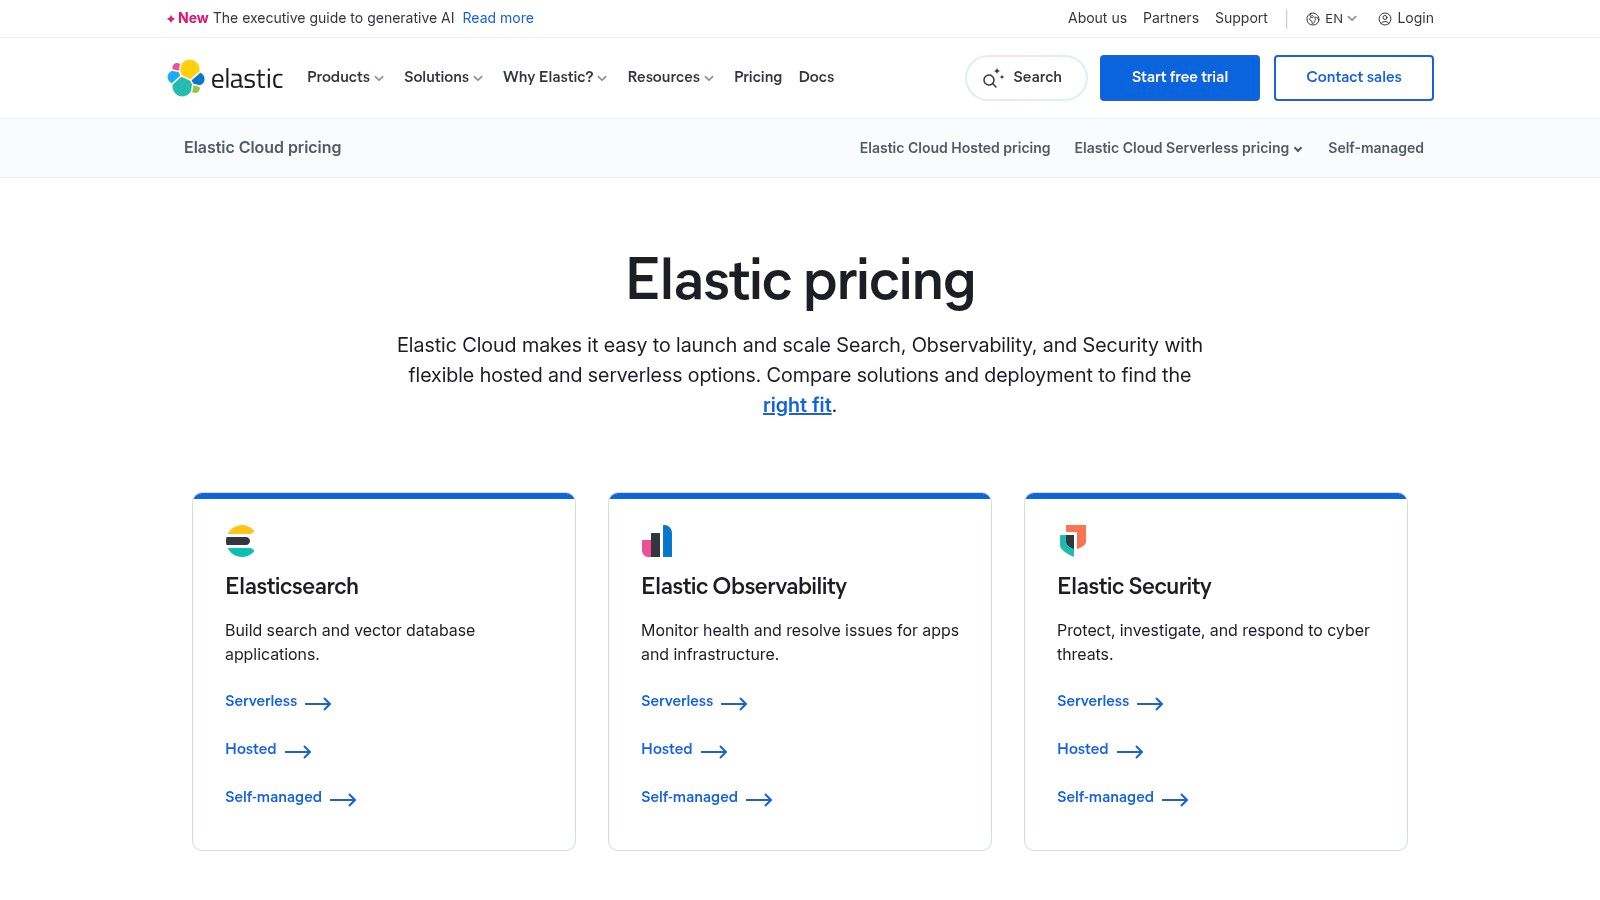
Elastic's strength lies in its flexibility. You can run it self managed, on their hosted Elastic Cloud, or opt for a serverless model. This adaptability appeals to startups that might begin with a small cloud deployment and later require a more customized, self hosted setup as they scale. The ability to correlate a slow Django request trace with application logs and underlying infrastructure metrics, all within one UI, is a significant workflow enhancement.
Pricing & Implementation
Elastic offers resource based pricing, where you pay for the compute, storage, and data transfer you consume. This can be more cost effective than per host models for certain workloads, especially those with spiky traffic. Their Serverless Observability "Complete" tier aims to simplify this by bundling features into a full stack offering. However, the pricing model, with its multiple meters for ingest, retention, and egress, can be complex to forecast accurately. Teams should carefully monitor their usage to avoid unexpected costs. It is also wise to confirm the pricing region, as it can sometimes default to a non U.S. locale.
- Pros: Flexible deployment models (hosted, serverless, self managed), attractive ingest and retention pricing, single platform for search, observability, and security.
- Cons: Pricing can be complex with multiple meters to track; some pricing pages may default to non English locales, requiring a switch to the U.S. region for accurate pricing.
- Website: https://www.elastic.co/pricing
7. Sentry – Performance Monitoring for Developers
Sentry has carved out a powerful niche by positioning itself as one of the most developer centric application performance monitoring tools available. It began with best in class error tracking and has since expanded into a robust performance monitoring solution that speaks the language of engineers. Its core strength lies in connecting a performance bottleneck, like a slow database query in a Django view or a large asset loading on the frontend, directly back to the specific line of code and the Git commit that introduced it. This tight integration with developer workflows makes it incredibly actionable.
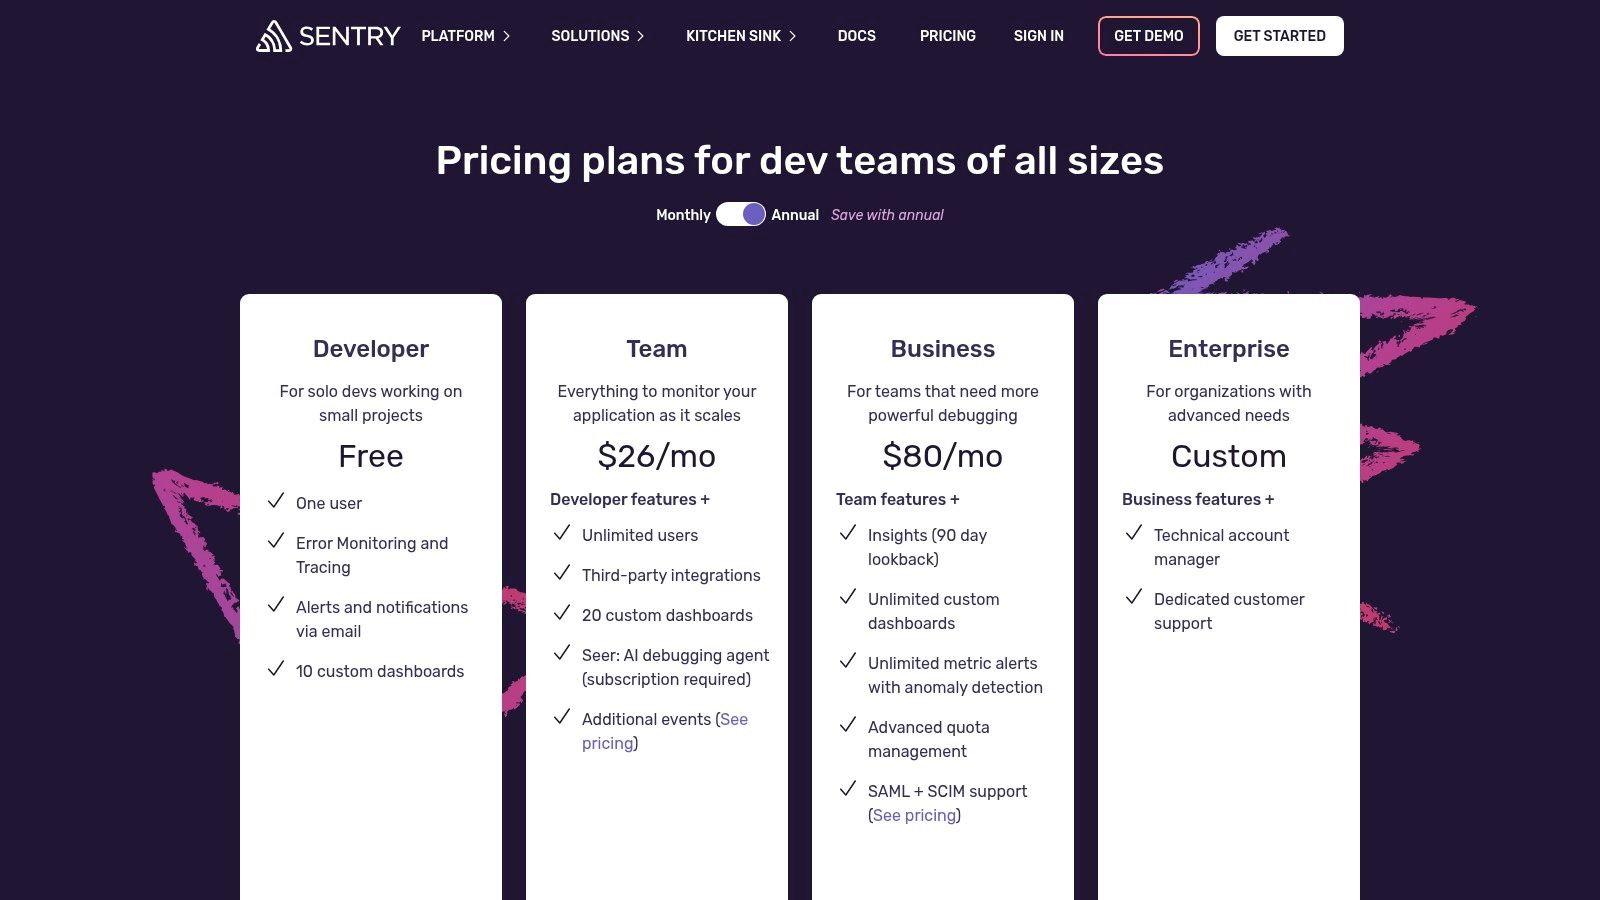
The platform automatically detects common performance issues and provides distributed tracing across both frontend and backend services. For teams that live inside their IDE and Git, Sentry feels less like a separate monitoring system and more like an extension of their development environment. Add on features like Session Replay provide even deeper context into user experience issues.
Pricing & Implementation
Sentry's pricing model is built for a self serve, bottom up adoption, with a free developer tier and transparent, usage based plans that are easy to start with. The paid Team plan starts at $26 per month (billed annually) and includes a base quota of events, replays, and transaction monitoring. The key is to manage your quotas effectively, as high volume applications can see costs rise if not properly configured with sampling. Implementation is typically straightforward, often just involving adding an SDK to your application.
- Pros: Low barrier to entry with transparent self serve plans, strong developer workflow integrations (Git/PR), often more cost effective than full stack observability platforms.
- Cons: Not a full infrastructure or log management platform and is often paired with other tools; high volume organizations need careful quota tuning to control costs.
- Website: https://sentry.io/pricing/
8. Grafana Cloud – Application Observability (LGTM Stack)
Grafana Cloud leverages the popular open source LGTM Stack (Loki, Grafana, Tempo, Mimir) to offer a managed, comprehensive observability platform. It has become a go to choice for teams that prefer building on an open source foundation and want to avoid vendor lock in. This makes it one of the more flexible application performance monitoring tools, especially for startups already comfortable with Prometheus or OpenTelemetry. The platform unifies metrics, logs, traces, and now profiles, providing a cohesive environment to diagnose issues from frontend to backend.
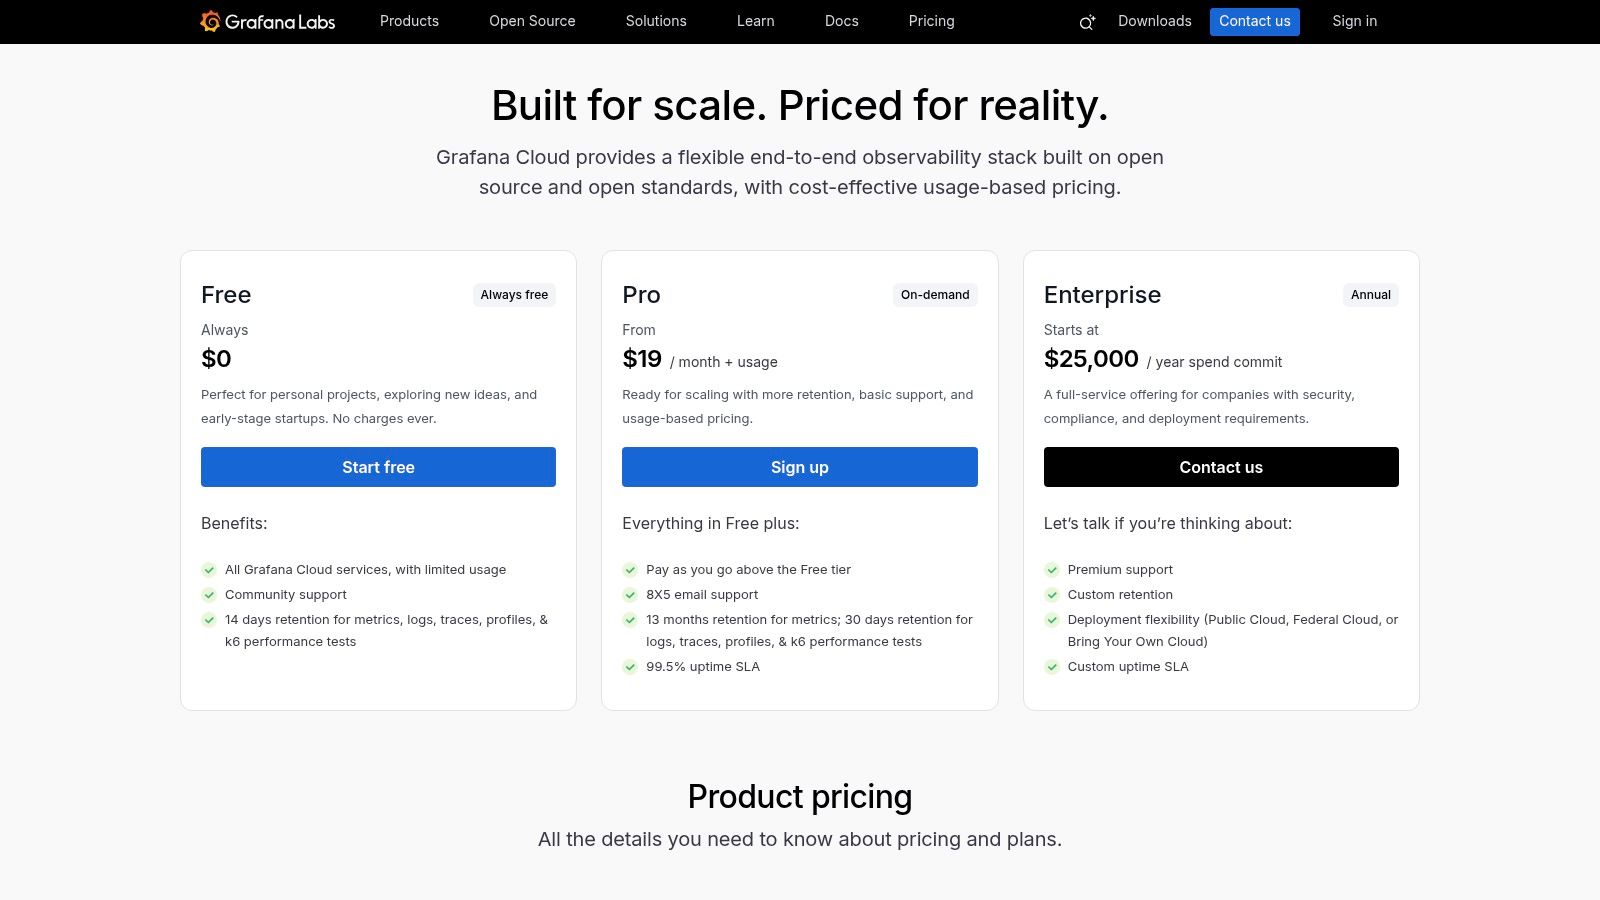
What makes Grafana Cloud particularly appealing is its commitment to open standards, with first class OpenTelemetry support. This allows you to instrument your Django applications and Celery workers once and have the flexibility to send telemetry data to any compatible backend. The inclusion of k6 for performance testing, alongside Real User Monitoring (RUM) and synthetics, creates a powerful ecosystem for proactive performance management.
Pricing & Implementation
Grafana Cloud's pricing model is usage based and highly granular, which can be both a blessing and a challenge. The free tier is genuinely useful for small projects or for teams wanting to run a thorough evaluation. Paid plans are metered by usage for metrics, logs, traces, and other services. While this provides transparency and control, forecasting costs for a rapidly scaling infrastructure can be complex. You need to carefully monitor your data ingestion and retention to avoid unexpected bills.
- Pros: Generous and useful free tier, built on a popular open source stack, strong OpenTelemetry support.
- Cons: Granular, usage based pricing can be complex to forecast at scale; some advanced features and plugins are enterprise add ons.
- Website: https://grafana.com/support/plans
9. ServiceNow Cloud Observability (formerly Lightstep)
ServiceNow Cloud Observability, the platform formerly known as Lightstep, is an enterprise focused solution that has carved a niche among application performance monitoring tools by deeply integrating with the broader ServiceNow ecosystem. Its core value proposition is unifying telemetry, including metrics, logs, and traces, directly into established ITSM workflows. This is a game changer for large organizations already standardized on the Now Platform, as it connects observability data directly to incident response, SLO management, and automated root cause analysis, reducing the operational distance between detecting a problem and resolving it.
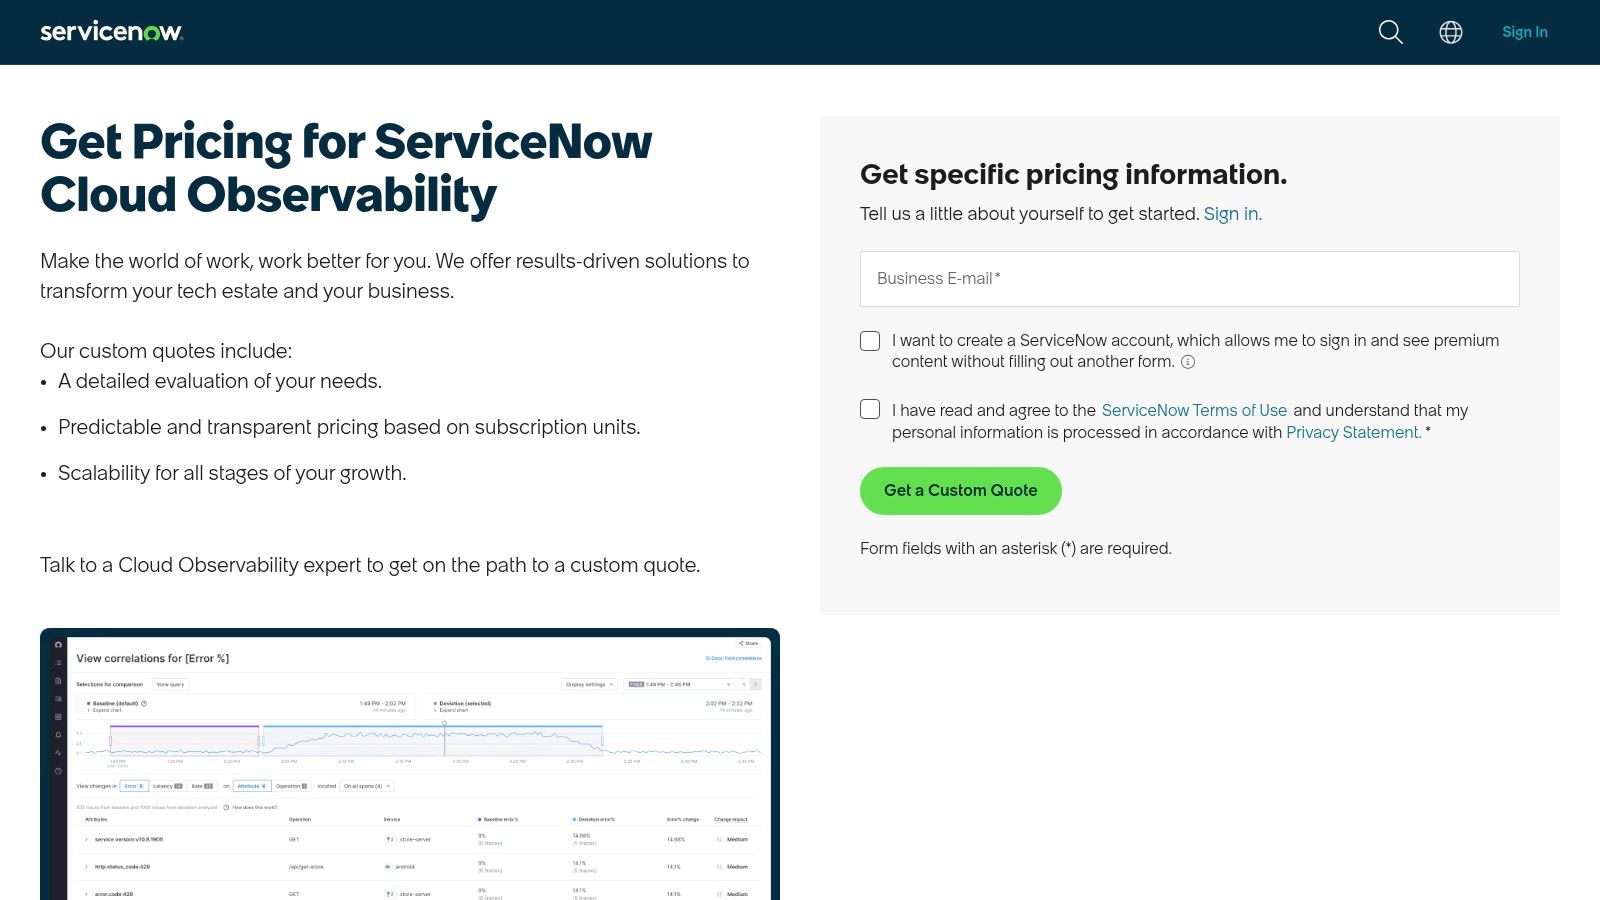
The platform is built on an OpenTelemetry native foundation, ensuring modern compatibility and avoiding vendor lock in for data collection. For teams managing complex procurement cycles, its availability on cloud marketplaces like Google Cloud can significantly simplify contracting and billing by consolidating expenses with existing cloud spend.
Pricing & Implementation
ServiceNow does not provide public list pricing for its Cloud Observability product; a custom quote is required. The pricing model is designed for enterprise procurement, and the total value is often most apparent when the tool is leveraged alongside other ServiceNow modules like IT Service Management (ITSM). For a startup, this enterprise focus and quote based model might present a higher barrier to entry compared to tools with transparent, self service pricing tiers.
- Pros: Deep integration with ServiceNow ITSM and incident processes, Marketplace procurement simplifies contracting and billing, good fit for enterprises standardizing on ServiceNow.
- Cons: Public list pricing not shown and requires a quote, best value often realized when used alongside the broader ServiceNow suite.
- Website: https://www.servicenow.com/lpgp/pricing-observability.html
10. AWS X‑Ray – Distributed Tracing for AWS
For teams deeply embedded in the Amazon Web Services ecosystem, AWS X‑Ray provides a native and cost effective entry point into the world of application performance monitoring tools. It is not a full featured APM suite like its commercial counterparts, but a powerful distributed tracing service. X‑Ray excels at helping you analyze and debug production, distributed applications, particularly those built using microservices or serverless architectures like AWS Lambda. It generates detailed service maps that visualize request paths, helping you pinpoint bottlenecks and understand latency across your entire stack.
The primary advantage is its seamless integration with other AWS services. Traces from API Gateway, Lambda, and EC2 instances are easily collected and correlated within the AWS console, providing a unified view without complex setup. This tight coupling is especially valuable for diagnosing issues in complex, event driven systems. You can learn more about event driven architecture patterns to better leverage tools like X‑Ray.
Pricing & Implementation
AWS X‑Ray's pricing is one of its most compelling features, especially for startups. It operates on a pay as you go model with a very generous free tier, which includes the first 100,000 traces recorded and the first 1,000,000 traces retrieved or scanned each month. After the free tier, costs are extremely low, calculated per trace recorded, retrieved, and scanned. This makes it virtually free to get started and experiment with distributed tracing for many small to medium sized applications. Implementation involves using the X‑Ray SDKs for your application's language (Python, Node.js, Go, etc.) to instrument your code.
- Pros: Extremely low cost with a generous free tier, tight AWS integration and easy IAM/console access, good starting point for serverless and microservices on AWS.
- Cons: Feature set is narrower than full commercial APM suites; cross cloud visibility requires extra tooling.
- Website: https://aws.amazon.com/xray/
11. Azure Monitor – Application Insights (Microsoft Azure)
For teams deeply embedded in the Microsoft ecosystem, Azure Monitor's Application Insights is a natural and powerful choice among application performance monitoring tools. It is not just a bolt on service; it is the native observability solution for Azure. This tight integration means you get a seamless experience for monitoring Azure Functions, App Services, and container workloads running on AKS. Application Insights automatically discovers dependencies, mapping out how your services communicate, which is invaluable for diagnosing bottlenecks in a microservices architecture.
Its strength lies in its unified approach within Azure. Telemetry data flows directly into Log Analytics workspaces, allowing you to run powerful Kusto Query Language (KQL) queries to correlate traces from a Django app with platform level metrics and activity logs. Smart Detection automatically surfaces performance anomalies, saving engineering teams from constant manual dashboard checks.
Pricing & Implementation
Azure Monitor uses a pay as you go, consumption based pricing model, primarily driven by data ingestion and retention. This can be cost effective for startups with variable workloads, as you only pay for what you use. However, understanding the billing details across different data types, web tests, and alert rules can be complex. You need to carefully monitor your ingestion volume to avoid unexpected costs. For predictable workloads, capacity reservation options offer discounts.
- Pros: Seamless integration with Azure services and RBAC, flexible retention and capacity reservation options, enterprise compliance and wide U.S. region coverage.
- Cons: Pricing page and billing model are complex across data types and features; cross cloud and on prem visibility requires extra configuration.
- Website: https://azure.microsoft.com/en-us/services/application-insights/
12. Google Cloud Operations Suite (Cloud Monitoring, Trace, Profiler)
For teams deeply embedded in the Google Cloud ecosystem, the native Google Cloud Operations Suite is a compelling set of application performance monitoring tools. It is not a single, unified product in the way some competitors are, but rather a collection of powerful, individually priced services including Cloud Monitoring, Cloud Trace, and Cloud Profiler. This à la carte approach provides granular control over costs and capabilities, making it a pragmatic choice for startups building on GCP, especially those leveraging Google Kubernetes Engine (GKE) for containerized applications like Django and Celery.
The suite's key strength lies in its seamless integration with other GCP services. Traces from your GKE deployed application automatically link to logs and metrics without complex configuration. The native support for Managed Service for Prometheus also simplifies metric collection for teams already invested in the Prometheus and Grafana ecosystem, allowing for a smoother transition.
Pricing & Implementation
Google Cloud's pricing is famously granular and usage based, which can be both a blessing and a curse. Each service (Monitoring, Logging, Trace) has its own pricing metric, such as MiB of data ingested or millions of spans processed. While this offers transparency and the potential for cost savings, it requires diligent monitoring to avoid unexpected bills. The generous free monthly allotments for each service are a huge advantage for early stage startups, allowing them to implement robust monitoring from day one. For instance, Cloud Trace includes 2.5 million spans for free each month, and the powerful Cloud Profiler is available at no extra charge.
- Pros: Excellent for GCP centric and Kubernetes workloads, generous free tiers for key services, profiler included without additional charge.
- Cons: Pricing is split across multiple products and can be intricate to forecast; achieving cross cloud visibility requires additional configuration and effort.
- Website: https://cloud.google.com/products/operations
Top 12 Application Performance Monitoring (APM) Tools Comparison
| Product | Core features | UX & integrations | Pricing / value | Best for | Key tradeoffs |
|---|---|---|---|---|---|
| Datadog – Application Performance Monitoring | Distributed tracing, service maps, continuous profiler, RUM, logs, synthetics | Strong dashboards; very large integration ecosystem; automatic service discovery | Clear published APM pricing; on‑demand & annual; costs grow with hosts; requires Infrastructure plan per APM host | Cloud‑native teams wanting fast SaaS onboarding | Can get expensive at scale; infra plan required |
| New Relic – APM & Full‑Platform Observability | APM, infra, logs, RUM, synthetics, traces (50+ capabilities) | Generous free tier; 780+ integrations; simple single‑platform UX | Usage‑based billing (users + GB); 100 GB/mo free tier; simple to start | Teams needing simple billing and a generous free tier | Data overages can add up; some enterprise controls gated |
| Dynatrace – All‑in‑one APM with AI | Automated topology (Smartscape), code‑level APM, Davis AI, Grail | Highly automated discovery & root‑cause; strong Kubernetes visibility | Usage‑based memory GiB‑hour pricing; public rate card | Teams needing automated RCA and deep K8s observability | Memory‑GiB‑hour model unfamiliar; advanced features often in full tier |
| Cisco AppDynamics – Enterprise APM | Business transaction tracing, analytics, RUM, SAP monitoring | Enterprise‑grade UX for hybrid/monolithic stacks; agent & OTEL options | Per‑core pricing across editions; enterprise licensing | Large enterprises, SAP or traditional app environments | Per‑core licensing expensive; many add‑ons sold separately |
| Splunk Observability Cloud (Splunk APM) | NoSample full‑fidelity traces, streaming analytics, continuous profiling | Fast streaming alerts; strong tracing at scale; 200+ integrations | Public, module‑level pricing; annual rates often best | High‑cardinality tracing and streaming analytics needs | Must assemble SKUs to build full stack; annual best rates |
| Elastic Observability (Elastic APM) | Logs, metrics, traces, synthetics, profiling; OpenTelemetry‑first | Flexible deployments: hosted, serverless, self‑managed; good for Elastic users | Resource‑based pricing (ingest/retention/egress); serverless options | Teams already on Elastic or needing deployment flexibility | Multi‑meter pricing can be complex to forecast |
| Sentry – Performance Monitoring for Developers | Error monitoring, distributed tracing, code‑level profiling, RUM add‑ons | Developer‑centric workflows; Git/PR integrations; self‑serve onboarding | Transparent self‑serve plans; affordable for dev teams | Engineering teams wanting code‑level insights and low barrier | Not a full infra/log platform; needs pairing for infra telemetry |
| Grafana Cloud – Application Observability | Metrics, logs, traces, profiles, RUM, k6 testing; OpenTelemetry support | Open‑source‑first UX; BYO data sources; useful free tier | Transparent unit pricing per host‑hour & meters; free tier | Teams preferring OSS stack and granular pricing | Unit menu can be complex to forecast; enterprise add‑ons |
| ServiceNow Cloud Observability (Lightstep) | Unified metrics/logs/traces, SLOs, automated root‑cause tied to workflows | Deep ServiceNow ITSM integration; incident automation & marketplace procurement | Quote required; procurement via cloud marketplaces | Enterprises standardizing on ServiceNow platform | No public pricing; best value with broader Now suite |
| AWS X‑Ray – Distributed Tracing for AWS | Traces, service maps, latency analysis; SDKs for multiple languages | Native AWS UX; integrates with CloudWatch and IAM | Pay‑as‑you‑go with generous free tier; low cost entry | Serverless & microservices on AWS seeking low cost tracing | Narrower feature set vs commercial APMs; cross‑cloud limited |
| Azure Monitor – Application Insights | Automatic instrumentation, dependency maps, synthetics, Log Analytics | Seamless Azure integration, RBAC & compliance; pipeline integration | Ingestion‑based pricing with reservation/retention options | Workloads running on Azure with native compliance needs | Complex billing across data types; cross‑cloud needs extra setup |
| Google Cloud Operations Suite | Cloud Monitoring, Trace, Profiler, Logging; GKE/Prometheus support | Strong GCP integration; profiler included; transparent free allotments | Usage‑based pricing with free monthly allotments (e.g., spans) | GCP‑centric teams and Kubernetes (GKE) workloads | Pricing split across products; cross‑cloud requires extra work |
| Splunk Observability Cloud (duplicate) | NoSample tracing, streaming analytics, continuous profiling | Fast alerts; strong tracing at scale | Public module pricing; assemble SKUs | High‑cardinality tracing needs | SKUs required; annual billing best |
So, Which Tool Lets You Sleep at Night?
We have navigated the expansive landscape of modern application performance monitoring tools, from the all encompassing platforms like Datadog and New Relic to the developer first approach of Sentry and the open source powerhouse that is Grafana Cloud. The journey through twelve distinct options makes one thing abundantly clear: there is no single "best" APM tool. The real question is not "Which tool is number one?" but rather, "Which tool tells the clearest story about my specific application's health?"
The answer, as is often the case in engineering, is "it depends". Your ideal tool is a direct reflection of your team's context, your technology stack, and your budget. It is a decision rooted in strategic trade offs. For a startup running entirely on Amazon Web Services and needing to get visibility quickly, firing up AWS X Ray is a logical, low friction first step. Conversely, an engineering team that prides itself on a deep open source ethos and already uses Prometheus for metrics will find Grafana Cloud's Application Observability a natural and powerful extension of their existing workflow.
Let us pause and reflect. We have seen the options, from the enterprise giants to the developer darlings. Now, how do you actually make the call?
Making Your Final Decision
After working with dozens of startups, I have seen a common pattern emerge. The selection process should not be a theoretical exercise based on marketing websites. It must be a hands on evaluation that answers one critical question: which tool provides the fastest "time to insight" for your team? When a production alert wakes you up at 3 AM, you need a dashboard that does not just show you a spike in a graph but immediately points you toward the root cause.
Here is a practical path forward:
- Identify Your Primary Pain Point: Are you blind to database query performance in your Django app? Are your Celery background tasks a complete black box? Is cross service latency in your microservices architecture causing silent failures? Start with the problem, not the solution.
- Create a Shortlist: Based on your core problem and budget, select two or three promising candidates from our list. For instance, if your primary issue is frontend and backend error correlation, your shortlist might include Sentry, Datadog, and Elastic APM.
- Run a Proof of Concept (PoC): Instrument a single, non critical service with your shortlisted tools. Do not try to boil the ocean. The goal is to see which agent is easier to install, which UI is more intuitive, and which one surfaces meaningful data with the least amount of configuration wrangling.
- Evaluate the "Aha!" Moment: The winning tool is the one that gives your team that moment of clarity first. It is the one where a junior developer can look at a trace and understand the lifecycle of a request without needing a senior engineer to translate it for them.
Key Takeaways
Remember that adopting one of these powerful application performance monitoring tools is more than just a technical change; it is a cultural one. It shifts your team from reactive firefighting to proactive optimization. It transforms conversations from "the site feels slow" into data driven discussions like "P95 latency on the /api/v1/checkout endpoint increased by 200ms after the last deploy, and the trace points to a slow running JOIN on the payments table".
The ultimate goal is to build a more resilient, observable system that empowers your team to ship features with confidence. The right APM tool is your partner in that mission, the silent guardian that watches over your code in production so that you and your team can, in fact, sleep at night. It transforms the chaos of production incidents into a clear, actionable narrative, giving you back your most valuable resource: time to build what's next.
Navigating these trade offs and implementing a full observability strategy can be daunting, especially when you are scaling fast. If you are a founder or CTO looking for a second opinion on your architecture or need hands on guidance to select and implement the right application performance monitoring tools for your startup, Kuldeep Pisda offers on demand technical mentorship and CTO as a service. Let's turn your performance mysteries into a clear, actionable roadmap for success. Find out more at Kuldeep Pisda.
Subscribe to our newsletter.
Become a subscriber receive the latest updates in your inbox.

Member discussion