

It always starts the same way. A well meaning manager, maybe feeling some pressure from above, asks for a "productivity report."
That request sends a quiet wave of panic through the engineering team. Suddenly, everyone's scrambling to pull numbers and create charts filled with metrics that just feel… hollow. Lines of code? Story points? It's a familiar scramble, and if you've been in this industry long enough, you've probably felt that same sinking feeling.
This experience is nearly universal because it highlights a fundamental truth: measuring engineering work is incredibly hard. I've been there myself, trying to justify my team's hard work by pointing to a flurry of activity that had little to do with the actual value we were creating. The core of the problem is that we keep trying to apply factory floor models to what is fundamentally a creative, problem solving discipline.
Software engineering isn't about assembling widgets on a predictable assembly line. It's a journey through a maze of complex, often invisible challenges. An engineer might spend an entire day just thinking, wrestling with a single elusive bug, and write only three lines of code. But those three lines? They could be the most valuable work done all week, preventing a major outage or unlocking a critical new feature. On the flip side, someone could churn out a thousand lines of boilerplate code that adds little real value and only increases the maintenance burden down the road.
This infographic breaks down these core challenges perfectly.
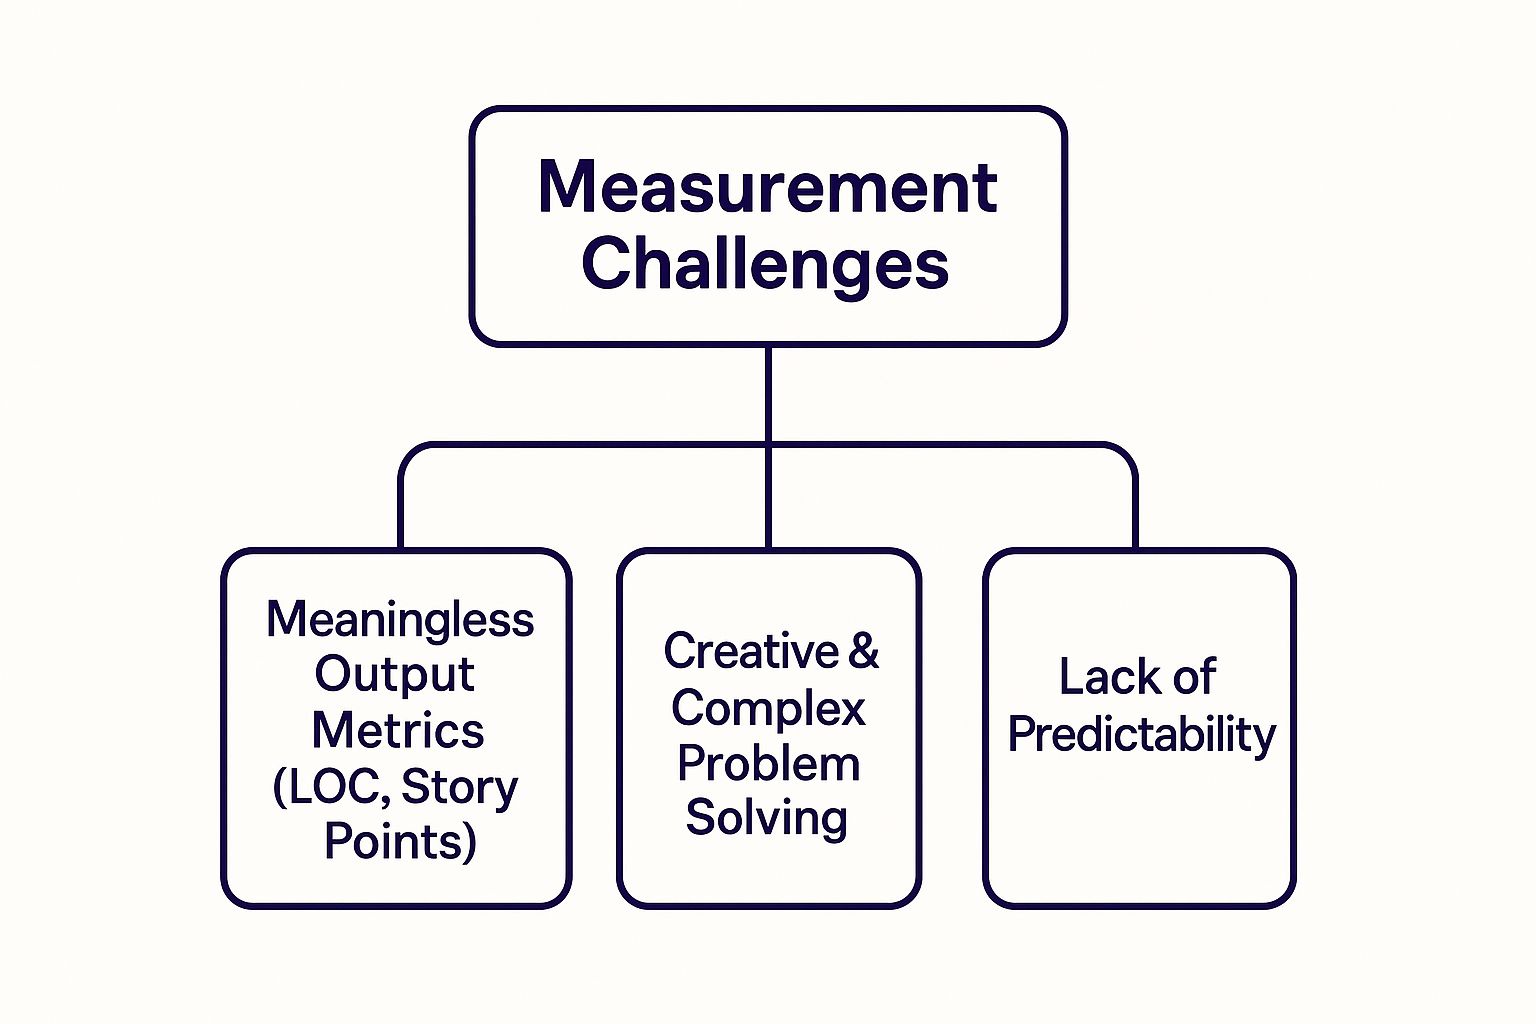
As the graphic shows, the creative nature of the work, its inherent lack of predictability, and our over reliance on flawed output metrics create a perfect storm, making engineering productivity measurement a massive headache. Before we go deeper, let's pause and reflect: if the old ways are broken, what does a better path look like?
Why Is Measuring Engineering Work So Difficult?
The Myth of Predictable Output
Classic productivity formulas are simple: output divided by input. And while a general guide on how to calculate productivity can offer some foundational concepts, it falls apart with software. In our world, both the inputs (time, cognitive load) and the outputs (actual value, elegant solutions) are notoriously difficult to pin down.
Engineering is a discovery process. You start with a hypothesis about how to solve a problem, and you learn as you build. The path is rarely a straight line.
This constant learning and adaptation makes planning and estimation a perpetual challenge. If you want to go deeper on this topic, check out our guide on creating a more realistic software project estimate. The key is to stop treating engineering like a deterministic process. It's not.
Valuing Outcomes Over Outputs
This is where the real paradigm shift needs to happen. We have to stop asking, "How much did you do?" and start asking, "What was the result?"
When we focus on outputs like commits or tickets closed, we just encourage busywork. We create an environment where developers optimize for looking productive instead of being effective.
Here's why that's so dangerous:
- It punishes thoughtful work. The engineer who spends time designing a robust, scalable solution will have fewer commits than someone who rushes out a quick and dirty fix.
- It ignores quality. Lines of code tell you nothing about whether that code is tested, maintainable, or secure.
- It erodes trust. When teams feel like they're being judged by vanity metrics, morale plummets. A culture of gaming the system starts to take hold, and nobody wins.
By acknowledging this shared frustration, we can finally start to chart a better course. The rest of this guide is dedicated to exploring a more humane, effective path forward—one that values the health of the system over individual numbers and focuses on the outcomes that truly matter to the business and its users.
Exploring Modern Frameworks for Productivity
To get a real handle on engineering productivity, we have to let go of the old habits that failed us. For years, the industry leaned on simple, countable outputs, with Lines of Code (LOC) being the most notorious offender. It felt easy, tangible, and objective. We tried it because, well, it was there.
But measuring a developer's contribution by LOC is like judging a novelist by the number of words they write. A powerful, concise story can be far more impactful than a bloated, meandering manuscript. Similarly, a senior engineer might solve a complex problem with ten elegant lines of code, while a junior might write a hundred lines that introduce technical debt. The number tells you nothing about the value, quality, or maintainability of the work.
It's a classic case of measuring activity, not achievement.
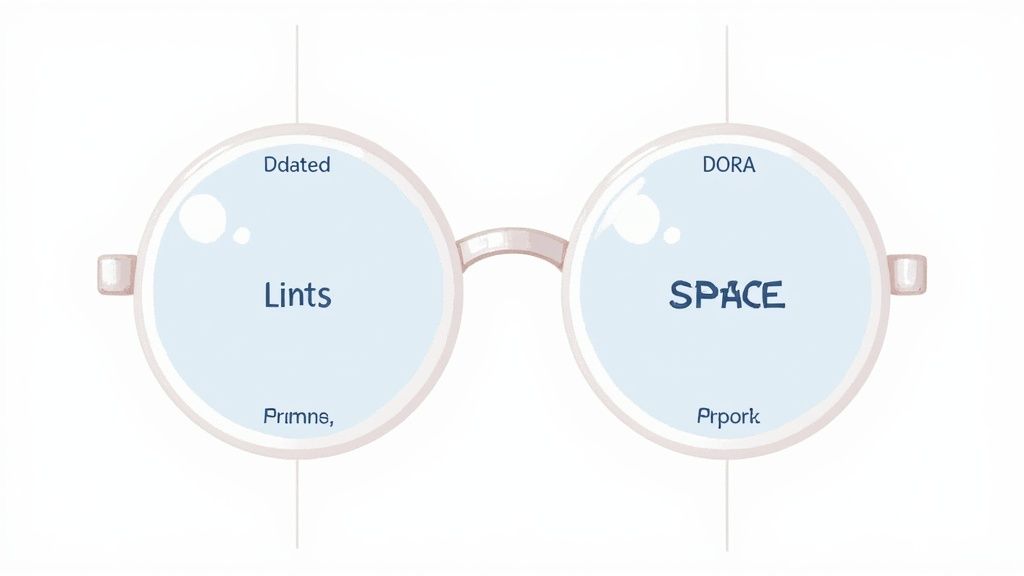
Thankfully, the conversation has matured. We now have modern frameworks that act as different lenses, helping us see the entire system from multiple angles. Two of the most respected are the DORA metrics and the SPACE framework. Think of them not as competitors, but as complementary tools for understanding both the health of your delivery pipeline and the well being of your team.
DORA Metrics: Your System's Vital Signs
The DORA (DevOps Research and Assessment) metrics came out of years of rigorous academic and industry research and are now widely considered the gold standard for measuring the performance of a software delivery process.
Think of them as the vital signs for your engineering system. They don't care about individual performance; they measure the health and speed of your entire delivery pipeline from commit to deployment.
DORA zooms in on four key areas:
- Deployment Frequency: How often are you successfully releasing to production? Elite teams deploy on demand, multiple times a day.
- Lead Time for Changes: How long does it take to get a commit into production? This measures the raw speed and efficiency of your entire development process.
- Change Failure Rate: What percentage of your deployments cause a failure in production? This is a direct indicator of quality and stability.
- Time to Restore Service: When a failure inevitably occurs, how quickly can you recover? This measures your system's resilience.
This screenshot from the official DORA site visually breaks down these performance categories, showing how teams are benchmarked from low to elite performers.
The key insight here is that speed and stability are not trade offs. The data consistently shows that high performing teams excel at both, deploying faster and with fewer failures. For organizations looking to see where they stand, a comprehensive DevOps Maturity Assessment and CI/CD Optimization can be a critical first step.
The SPACE Framework: A Holistic View of Team Effectiveness
While DORA gives you a powerful, quantitative look at your delivery machine, the SPACE framework provides a more qualitative and human centric view. Developed by researchers from Microsoft and the University of Victoria, it acknowledges a simple truth: productivity is a complex, human concept that can't be captured by system metrics alone.
SPACE suggests looking at productivity through five equally important dimensions:
S - Satisfaction and well being P - Performance A - Activity C - Communication and collaboration E - Efficiency and flow
This model forces a balanced perspective. You might have amazing DORA metrics (Performance), but if developer Satisfaction is plummeting due to burnout, that performance is unsustainable. Likewise, high Activity (lots of commits and PRs) is meaningless if it doesn't lead to effective collaboration or efficient workflows.
These frameworks can even be applied to understand the impact of new technologies. We touch on similar ideas in our article exploring Retrieval-Augmented Generation for smarter AI.
By combining DORA's system level data with the human focused insights from SPACE, you get a much richer, more accurate picture of what's really going on. This combined approach moves the conversation away from individual judgment and toward a shared goal of building a healthier, more effective engineering culture.
Comparing DORA and SPACE Frameworks
To make it even clearer, here's a quick breakdown of how these two powerful frameworks differ and where they shine.
| Framework | Primary Focus | What It Measures | Best For |
|---|---|---|---|
| DORA | System Health | The speed and stability of the software delivery pipeline. | Getting objective, data driven insights into your DevOps process and identifying technical bottlenecks. |
| SPACE | Human Factors | A multi dimensional view of team well being, collaboration, and individual flow. | Understanding the human side of productivity, diagnosing burnout, and improving team health and satisfaction. |
Ultimately, DORA tells you what is happening in your delivery pipeline, while SPACE helps you understand why it's happening by looking at the people who build and maintain it. Using them together gives you the complete picture.
If DORA metrics are the vital signs of your delivery pipeline, the SPACE framework is the team's soul. It's a more human centric, story driven way to think about engineering productivity, reminding us that there's a person behind every single line of code.
The whole idea behind SPACE came from a simple realization: great software is built by people who feel supported, engaged, and able to do their best work without needless friction. It nudges us to look past the system outputs and see the entire human and technical ecosystem.
Let's unpack each part of the framework with a story. Stories are how we make sense of complex ideas, after all.

S for Satisfaction
This is all about how developers actually feel about their jobs—their work, their team, their tools, their culture. A happy, fulfilled engineer is almost always an engaged one. On the flip side, an engineer wrestling with burnout and frustration is a massive risk to both the project and the team's stability.
I once worked with a brilliant developer, "Alex," who was consistently our top committer. Looking at his activity metrics, you'd think he was a machine. But when we started running anonymous quarterly surveys, a completely different picture emerged. Alex reported feeling totally burned out, frustrated by a flaky CI/CD pipeline and a lack of clear product direction.
He felt like he was just running on a treadmill, working incredibly hard but going nowhere. Six months later, he was gone. His departure left a huge knowledge gap and just tanked team morale for weeks. It was a classic case of amazing Activity metrics hiding a catastrophic Satisfaction problem.
Measuring satisfaction isn't a "nice to have." It's a leading indicator of retention, quality, and sustainable performance.
Here's how you can start measuring it:
- Regular Surveys: Use simple, anonymous surveys to ask about toolchain satisfaction, work life balance, and psychological safety.
- Retention Rates: Keep an eye on developer attrition, especially when a high performer you'd hate to lose decides to leave.
- Qualitative Feedback: Conduct one on ones and exit interviews to get that honest, direct feedback you won't find in a spreadsheet.
P for Performance
Performance, in the context of SPACE, isn't about output; it's about outcomes. It asks the most important question: is the software we're shipping actually working for our users and the business? It's less about the speed of delivery and more about the quality and reliability of what gets delivered.
This is where the principles of quality engineering really shine. Practices like test driven development aren't just about writing tests—they're about building confidence that the system will perform as expected. If you want to dive deeper, our guide on what is test driven development is a great place to start building more reliable code from the ground up.
A great performance measure? A low change failure rate. A team that ships code that rarely breaks in production is a high performing team, no matter how many story points they close.
A for Activity
Activity metrics are the easiest to collect and, frankly, the most dangerous to misuse. These are your raw output counts: commits, pull requests, code reviews, deployments. While they can provide a signal, they should never be the whole story.
Think about a project that required a massive database refactor. The team might go weeks with very few commits visible to the outside world. They're deep in research, planning, and painstakingly careful execution. A manager focused only on activity might see this as a period of low productivity.
But that quiet period could prevent years of future performance issues and technical debt. The activity doesn't reflect the immense value being created. Use activity metrics as a starting point for a conversation, never as a final judgment.
C for Communication
Communication and collaboration are the connective tissues of any successful engineering team. Great ideas can die in silos, and simple misunderstandings can lead to weeks of wasted work.
I remember a cross functional project between our backend team and a new mobile team that failed spectacularly. Why? The backend team communicated through detailed technical documents in Confluence, while the mobile team lived in a fast paced Slack channel.
Their communication styles were completely misaligned. Assumptions were made, dependencies were missed, and by the time we realized what was happening, we were weeks behind schedule. Measuring productivity effectively means looking at these seams between teams.
To get a handle on this, you can look at:
- Onboarding Speed: How quickly does a new team member get up to speed and start contributing?
- Code Review Quality: Look at the comments on pull requests. Are they constructive, clear, and timely?
- Documentation Health: Can people actually find the information they need, and is it up to date?
E for Efficiency
Efficiency is all about flow. How easily can an engineer move their work from an idea into production? This is about removing friction, automating tedious work, and minimizing interruptions.
The big historical challenge with measuring engineering productivity has always been the variability of the work. In other fields, you can create standardized metrics. But engineering work, which can influence 80% of total project costs, has been notoriously difficult to track with any consistency. One study developed a method to convert diverse design elements into a common unit called 'basis hours', creating a more coherent way to measure efficiency across different disciplines. You can learn more about this breakthrough over at construction-institute.org.
For software teams, efficiency means looking at things like:
- Lead Time: How long does it take from commit to deployment? (This one overlaps directly with DORA).
- Time Spent on Rework: How much time are developers spending fixing bugs from previous sprints?
- Developer Feedback on Tooling: Are your developers waiting minutes or even hours for builds and tests to complete?
By looking at these five dimensions together, SPACE gives you a rich, balanced view of your team's health and effectiveness. It shifts the conversation from "Are you busy?" to "Are we building a sustainable system for creating value?"
Common Pitfalls and How to Avoid Them
Powerful tools, when used without care, can cause a lot of damage. This is especially true when it comes to measuring engineering productivity. I've seen teams with the best intentions accidentally create a culture of fear by misinterpreting the data.
It's an easy trap to fall into because numbers feel so objective. But when we forget the human element, we start breaking the very systems we're trying to improve.
Let's walk through some of the most common pitfalls I've encountered and, more importantly, how you can steer clear of them. This isn't just theory; these are lessons learned from real teams, sometimes the hard way.

Caption: When you think tracking commits per developer is a good idea.
Weaponizing Metrics Against Individuals
This is the cardinal sin of productivity measurement. It happens when a manager takes a dashboard intended for system level diagnosis and turns it into a leaderboard to compare developers. Suddenly, metrics like pull request counts or story points become weapons in performance reviews.
I once worked on a team where this happened. A manager started praising one developer for consistently merging the highest number of PRs each week. On the surface, it looked great. But what the metrics didn't show was that this developer was cutting corners on testing and documentation to move faster. I once got stuck on one of his bugs for hours before realizing he had skipped crucial validation.
A few months later, we were drowning in production bugs, almost all of them traced back to his hastily shipped code. The team's velocity ground to a halt as we scrambled to fix his "productive" work.
Preventative Advice: Make it an unbreakable rule that these metrics are anonymous and aggregated. They are for understanding the health of the system, not for stack ranking individuals. The conversation should always be about "our team's lead time" or "our system's change failure rate," never about a single person's numbers.
The Tunnel Vision Trap
Another common mistake is latching onto a single metric at the expense of all others. A team might become obsessed with increasing their Deployment Frequency, a key DORA metric. They push hard to ship code multiple times a day, celebrating every new deployment.
But in their pursuit of speed, they stop paying attention to their Change Failure Rate. More and more of those deployments start causing production incidents. They're moving faster, but they're also breaking things more often, eroding user trust and burning out the on call team.
This is a classic example of local optimization—you improve one part of the system while inadvertently making the whole thing worse.
Here's how to avoid it:
- Use Balanced Frameworks: This is exactly why frameworks like SPACE are so valuable. They force you to look at a balanced set of indicators, from Performance to Satisfaction.
- Pair Your Metrics: Always look at metrics in pairs. If you track Deployment Frequency, you must also track Change Failure Rate. If you look at throughput, you must also look at quality and system stability.
Forgetting to Set a Baseline
Imagine you want to improve your fitness. You start a new workout routine, but you never measure your starting weight or how far you can run. A month later, how do you know if you've made any progress? You can't.
The same applies to engineering teams. I've seen leaders roll out major process changes—like a new code review policy or a different branching strategy—without first measuring how the system was performing before the change.
Without a baseline, you're just guessing. You have no objective way to know if your brilliant new idea actually made things better, worse, or had no effect at all. All you have are feelings and anecdotes, which are easily biased.
Actionable Advice:
- Measure First: Before you change anything, collect at least a month's worth of data on your key metrics (like the DORA metrics). This is your baseline.
- Introduce One Change at a Time: Don't change five things at once. Introduce a single, specific change.
- Measure Again: After a month, compare your new numbers to your baseline. Now you have actual data to prove whether your change was effective.
By avoiding these pitfalls, you can transform engineering productivity measurement from a source of anxiety into a powerful tool for continuous, sustainable improvement.
Key Takeaways
We've walked through the messy history of measuring engineering productivity, from the old, frustrating habits to the more humane, modern ways of thinking. As we wrap things up, let's boil it all down to a few core ideas. Don't think of these as rigid rules, but more like a new mindset for building healthier, more effective engineering teams.
The biggest shift here is simple: move the focus from judging individuals to improving the system. This whole effort is about making life better for your developers so they can deliver more value. It's not about building leaderboards.
- Measure Outcomes, Not Just Output. This is the cornerstone. Instead of vanity metrics, ask: "Did our work actually matter?" Did we improve reliability, enhance the user experience, or pay down tech debt?
- Pair Hard Data with Human Experience. Numbers tell half the story. DORA metrics might look good, but a survey could reveal burnout. A healthy system is both fast and sustainable.
- Context Is Everything. Software is not a factory. Metrics from other disciplines rarely translate. A one size fits all model just doesn't work for creative, problem solving work. Discover more about these cross discipline comparisons to see why software needs its own unique approach.
- Productivity Is a Team Sport. A single developer can't be productive in a broken system. The goal of engineering productivity measurement is to find and fix the systemic problems holding the entire team back.
Frequently Asked Questions
Jumping into engineering productivity can feel like a massive project. It's totally normal to have questions about where to even begin, who gets to see the data, and how to build a healthy rhythm around it all. Let's dig into some of the most common questions I hear from teams just starting this journey.
How Do I Start Implementing The SPACE Framework Without Expensive Tools?
This is probably the question I get asked the most, and the good news is you can get going with almost no budget. The SPACE framework isn't a product you have to buy; it's a way of thinking about productivity. The real key is to start small and zero in on qualitative data first—that's often where the gold is hiding.
You can kick things off with simple, free tools you already use:
- Satisfaction: Use Google Forms or something similar to create short, anonymous surveys. Ask pointed questions like, "On a scale of 1 to 5, how happy are you with our current CI/CD pipeline?" or "How would you rate your ability to get into deep work this past sprint?"
- Communication: Just look at the data you already have. Are comments on pull requests actually helpful? How long does it take for a new developer to feel like they can confidently contribute? You can suss this out just by paying attention and having conversations.
- Efficiency: Fire up a conversation in your next retro. Ask the team, "What was the single biggest thing that slowed you down this week?" You'll get incredible insights without needing a single dashboard.
The goal isn't to build a perfect dashboard on day one. It's to start a conversation. Your most powerful tools at the beginning are genuine curiosity and a willingness to actually listen to your team.
Once you have this qualitative baseline, you can start to layer in quantitative data from systems you already have, like your version control or project management tools.
Should I Share Productivity Metrics With The Entire Team?
The short answer is an emphatic yes, but with one giant condition: the metrics have to be about the system, not the individuals. When it comes to measuring productivity, transparency is your best friend for building trust. The moment you hide the data, people will assume it's being used for secret performance reviews, and the whole initiative is dead in the water.
Sharing the metrics openly drives home the message that this is a team effort to improve your shared processes. It turns measurement from a "gotcha" tool into a collaborative way to solve problems.
Here's how to get it right:
- Aggregate and Anonymize: Never, ever show individual developer names next to numbers. Focus on team level trends, like the average lead time or the change failure rate for a specific service.
- Frame it as a Diagnostic Tool: Present the data as "health indicators" for your engineering system. The conversation should sound like this: "Hey, it looks like our lead time is creeping up. What are some of the potential causes we can dig into together?"
- Empower the Team: Give the team ownership of their own metrics. Let them decide which improvement metrics to track to address the bigger diagnostic trends you're seeing. This makes it their tool for getting better, not just a manager's report card.
When everyone sees the same data and understands why it's there, you build a culture of shared accountability and continuous improvement.
How Often Should We Review These Metrics?
The right cadence for reviewing metrics really depends on what you're trying to accomplish. Trying to review everything all the time is a surefire recipe for noise and burnout. A much healthier way to think about it is in two distinct speeds: a tactical loop and a strategic loop.
- The Tactical Loop (Weekly or Bi Weekly): This is for your team level improvement metrics. Think of it as a quick check in during your sprint retrospectives. For example, a team might be focused on reducing CI flakiness. They can check the test failure rate each week to see if what they're doing is actually working. This loop is all about making small, immediate tweaks.
- The Strategic Loop (Monthly or Quarterly): This is where you look at your high level diagnostic metrics, like the DORA metrics or the broader SPACE framework dimensions. This review should involve engineering leadership and focus on the bigger picture. Are you seeing a sustained drop in developer satisfaction? Is the overall change failure rate creeping up across multiple teams?
This dual cadence makes sure you're not overreacting to daily blips while still keeping a sharp eye on the long term health of your entire engineering organization. It's the balance between immediate action and thoughtful, strategic planning.
Feeling ready to move from theory to execution? As a consultant, Kuldeep Pisda helps startups build robust, scalable systems and implement healthy engineering practices. If you need an expert to help you strengthen your technical foundations and accelerate your roadmap, you can learn more at https://kdpisda.in.
Subscribe to our newsletter.
Become a subscriber receive the latest updates in your inbox.
Member discussion