

Ever been asked that dreaded question: "How do we know the engineering team is being productive?" It sends a chill down your spine, doesn't it? My mind immediately jumps to nightmares of stopwatches, keystroke counters, and managers celebrating the person who wrote the most lines of code.
I once worked on a project where a developer was lionized for committing thousands of lines of code in a single week. We celebrated his "output." The problem? We spent the next two weeks debugging the bloated, overly complex mess he'd created. That experience drove home a critical lesson: measuring the wrong thing is worse than measuring nothing at all. It's like judging a novel by its word count instead of its plot.

This guide is our journey away from that flawed mindset. We're going to explore how to use developer productivity metrics not as tools for micromanagement, but as instruments for diagnosing and improving your engineering system as a whole.
Shifting Focus from Output to Outcomes
The fundamental problem with metrics like lines of code or commits per day is that they incentivize the wrong behaviors. They reward busyness, not impact. Real productivity isn't about how much code gets written; it's about solving customer problems efficiently and shipping value that actually sticks.
Think of them as instruments for diagnosing and improving your engineering system as a whole. The goal is to ditch the vanity metrics and find meaningful insights that empower your team.
"True productivity is about balancing speed, collaboration, and most importantly, quality not just ticking boxes."
Getting this right requires a real cultural shift. You have to move away from the "code factory" mindset and towards fostering a collaborative environment that's laser focused on system health. We'll look at how to measure things that genuinely matter, like:
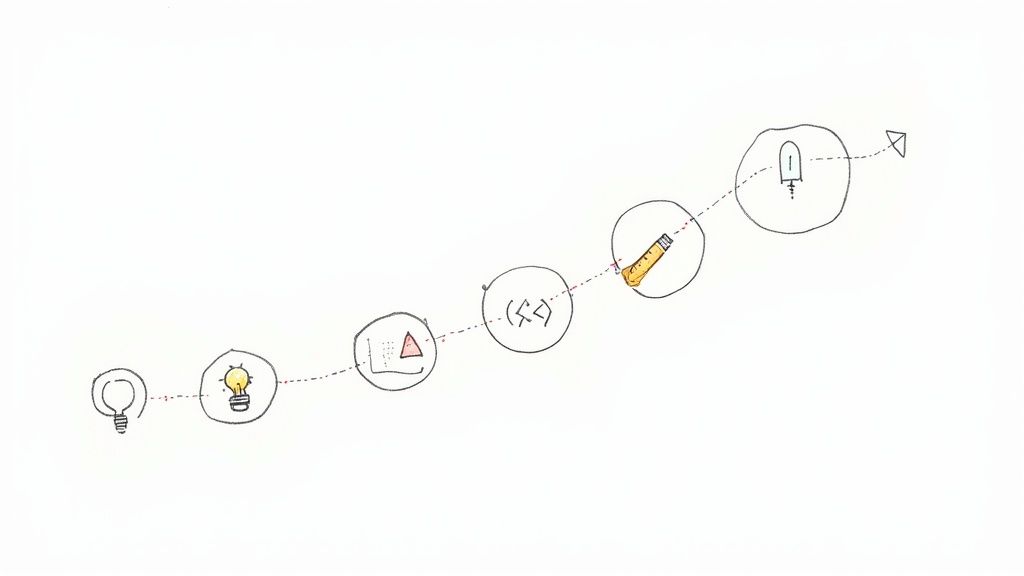
- Process Efficiency: How smoothly does an idea travel from a ticket to a production deployment?
- System Stability: Is the software we're shipping actually reliable?
- Team Collaboration: How quickly are we unblocking each other and working together?
To make real gains, you have to understand what makes a good measurement and what doesn't. You can learn more about practical tips to improve developer productivity by focusing on what your team actually needs.
This approach transforms measurement from a source of anxiety into a shared tool for continuous improvement. For instance, instead of just counting pull requests, we can analyze their review times a topic we cover in our guide on the 10 code review best practices that actually work. Together, we'll build a framework that helps you deliver faster without burning out your team or sacrificing quality.
What Good Developer Productivity Metrics Actually Measure
Before we dive into specific numbers, let's pause and get our philosophy straight. This is the exact spot where so many engineering leaders trip up. They hear "developer productivity metrics" and their minds jump to leaderboards or finding the "weakest link."
That approach is a straight up recipe for disaster. It kills morale, encourages developers to game the system, and ultimately measures frantic activity instead of actual progress.
Good metrics are not about tracking individual developers. Think of them as diagnostic tools for your entire engineering system. You wouldn't judge a Formula 1 driver just by how fast they move their hands on the wheel, would you? Of course not. You'd look at lap times, pit stop speed, and engine performance the health and flow of the whole operation.
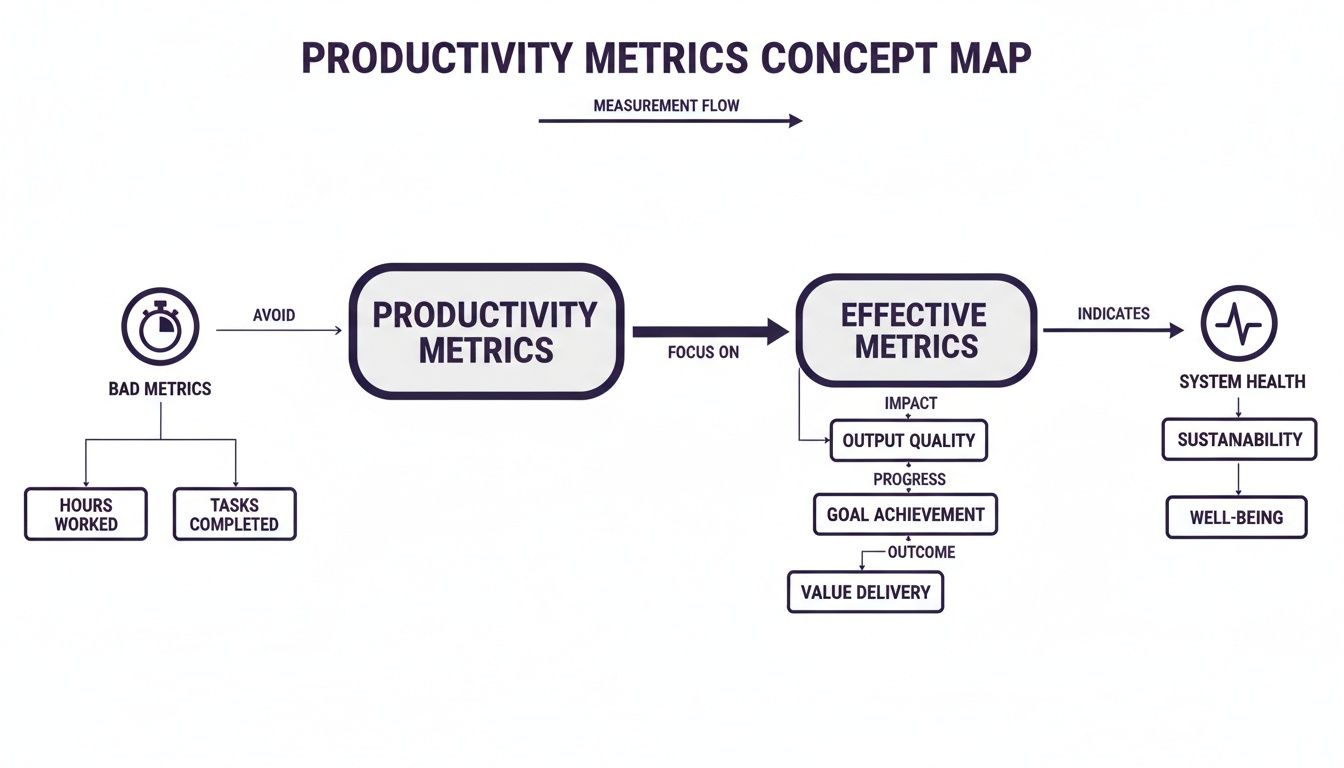
Outcomes Over Individual Output
The most important mental shift is moving from output to outcomes. Output is easy to count but often meaningless. Things like lines of code written, number of commits, or tickets closed are classic (and flawed) output metrics.
Outcomes, on the other hand, measure the real impact on the system and, most importantly, the customer. They help us answer the questions that actually matter:
- How smoothly and predictably can we ship value to our users?
- Are we building a stable, reliable product?
- What's getting in our way and causing friction for the team?
This shift changes the entire conversation from "Who's the fastest coder?" to "What's slowing our team down?" It's a subtle but incredibly powerful difference that aligns everyone on the same goal: improving the system together, not blaming individuals.
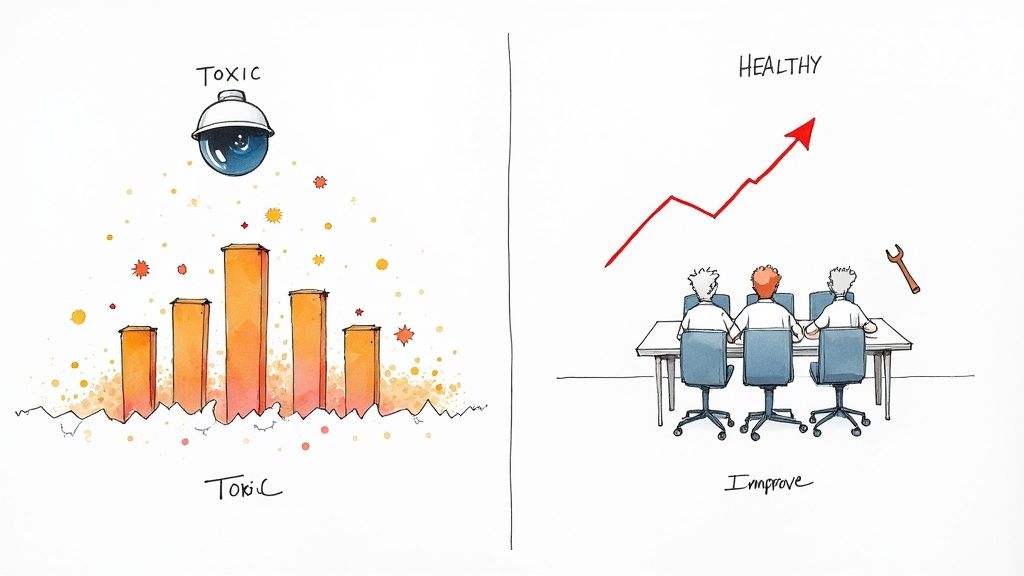
A healthy metrics program should feel like a collaborative tool that shines a light on opportunities for improvement, not an instrument of surveillance.
Introducing Guiding Frameworks DORA and SPACE
Luckily, we don't have to invent this philosophy from scratch. Industry pioneers have already created solid frameworks to guide our thinking. Two of the most respected are DORA and SPACE.
DORA (DevOps Research and Assessment) provides four key metrics that are like the vital signs for your software delivery process. They measure the two things every engineering org cares about: speed and stability. We'll get into the specifics later, but they offer a fantastic, high level snapshot of your team's health.
SPACE (Satisfaction & Well being, Performance, Activity, Communication & Collaboration, Efficiency & Flow) gives us a more holistic view. It's a crucial reminder that productivity isn't just about raw numbers. Developer happiness, communication patterns, and workflow friction are all critical pieces of the puzzle. SPACE helps ensure we don't optimize for speed at the cost of burning out our team.
To really drive home the philosophical shift, let's look at a comparison.
Old vs Modern Productivity Metrics A Philosophical Shift
This comparison highlights the evolution from tracking individual output to measuring overall system health and team flow.
| Metric Focus | Old (Flawed) Metric | Modern (System Health) Metric |
|---|---|---|
| Speed | Number of commits per day | Cycle time (from first commit to deploy) |
| Effort | Lines of code written | Pull Request size and review time |
| Quality | Number of bugs fixed | Change Failure Rate (deploys causing failure) |
| Team Health | Individual story points completed | Unplanned work vs. planned work |
The evolution here is clear. The modern metrics are all about flow, friction, and stability. They measure the system, not the person. They naturally encourage smaller batches of work, faster feedback loops, and a relentless focus on keeping the production environment healthy.
Adopting this mindset helps you see metrics as a shared language for improvement. For a deeper dive into this topic, check out our complete guide to engineering productivity measurement, which builds on these foundational ideas. The goal is to build a culture where data helps everyone work smarter, not just harder.
The Core Engineering Metrics That Truly Matter
Alright, we've talked philosophy. Now let's get our hands dirty and open up the diagnostic toolkit for your engineering engine. We're not looking for vanity numbers here, but for the real signals that tell us how smoothly everything is running from the first line of code to the final deployment.
This is all about shifting focus. Stop judging individual output and start understanding the entire delivery lifecycle as one interconnected system.
The DORA Metrics Foundation
If you're going to start anywhere, start with the DORA metrics. They're the gold standard for a reason. Think of them as the four vital signs of your software delivery health, giving you a balanced view of both speed and stability.
- Deployment Frequency: How often do you successfully ship to production? Elite teams deploy on demand, multiple times a day. This is a dead simple indicator of your team's agility and the health of your CI/CD pipeline.
- Lead Time for Changes: How long does it take for a commit to actually make it into production? This measures your entire delivery process, from code being pushed to code running. A short lead time means your process is lean and efficient.
- Change Failure Rate: When you deploy, what percentage of the time does it cause a production failure? This is your core stability metric. A low failure rate means you're shipping without breaking things for your users.
- Mean Time to Restore (MTTR): When a failure does happen (and it will), how long does it take you to fix it? MTTR is a crucial measure of your system's resilience and your team's ability to react when things go sideways.
These four metrics work together beautifully. You can't just push for faster deployments without keeping an eye on your failure rate. They force a balanced, holistic view of performance.
Essential Flow Metrics
Beyond DORA, a few other metrics give you a closer look at the day to day flow of work. These are the ones that help you pinpoint the specific bottlenecks slowing your team down.
The most powerful of these is Cycle Time. It measures the time from when a developer actually starts working on a task (think: first commit) to when it's fully delivered. While Lead Time for Changes measures the whole pipeline, Cycle Time zooms in on the active development phase.
A long Cycle Time is almost always a symptom of something else: massive pull requests, painfully slow review cycles, or fuzzy requirements. It's the "check engine" light for your development workflow.
This brings us to two closely related metrics: Pull Request (PR) Size and PR Review Time. Large PRs are notoriously difficult to review, which leads to long delays and shallow feedback. By tracking PR size (usually lines of code changed), you can encourage smaller, more frequent commits that are way easier to review and merge. This directly slashes PR Review Time and, in turn, crushes your overall Cycle Time.
Quality and Health Signals
Speed is worthless if you're shipping garbage. A couple of key metrics help keep you honest here: Code Churn and Unplanned Work.
Code Churn is the amount of code that gets rewritten or deleted shortly after it was committed. A high churn rate can point to a few different problems: maybe the requirements were a mess, the initial solution was buggy, or there's a ton of refactoring going on. It's a signal that work isn't landing right the first time.
Unplanned Work is the silent killer of roadmaps. This is the percentage of your team's time spent on urgent bug fixes, production fires, or other reactive tasks that weren't part of the plan. A high rate of unplanned work is a blaring siren that you're racking up technical debt or your system stability is crumbling.
Modern tools are already having a huge impact here. The JetBrains State of Developer Ecosystem 2025 report found that with 85% of developers now regularly using AI tools, core delivery metrics are shifting. Advanced tooling is expected to improve merge rates by 10% to 20% and slash average PR size by 15% to 25% directly impacting these flow and quality signals. You can explore the full analysis of the developer ecosystem to see how these trends are shaping team performance.
How to Instrument and Collect Your Metrics
Thinking about developer productivity metrics is one thing; actually getting your hands on the data is where the real work begins. The good news? You probably already have all the raw information you need. It's just scattered across different systems, waiting to be connected.
The goal isn't to build a perfect, all seeing dashboard overnight. It's to start small, tap into the tools you're already using, and slowly build a clear picture of your engineering workflow. Let's get practical and figure out how to pull this data together.
Starting with Your Source of Truth
Most of the foundational metrics like Deployment Frequency, Lead Time for Changes, and PR Size live right inside your version control system. Git is more than just a place to store code; it's a rich historical record of every decision, change, and collaboration.
You can start by pulling data directly from your Git provider (like GitHub, GitLab, or Bitbucket) using their APIs. Here's what you can get:
- Commit History: Every commit has a timestamp and an author. This is the starting point for calculating Cycle Time, which begins with the first commit on a feature branch.
- Pull Request Data: PRs are a goldmine. You can track creation dates, merge dates, review comments, and lines of code changed. This data feeds directly into metrics like PR Review Time and PR Size.
- Deployment Information: By using tags or specific merge strategies for releases, you can pinpoint exactly when code hits production. This is essential for measuring Deployment Frequency and Change Failure Rate.
Connecting to Your Workflow Tools
While Git tells you about the code, your project management tool tells you about the work. Tools like Jira, Linear, or Asana hold the "why" behind the code the user stories, bug reports, and planned tasks.
By connecting your Git data to your project management tickets (usually via branch names or commit messages like feat/PROJ 123), you can measure the full Cycle Time. This connects the start of development (first commit) to the ticket's final state ("Done" or "Deployed"). It's a crucial link for understanding the entire flow from idea to delivery. To get this right, some teams explore options like dedicated time tracking software for developers to help bridge these data sources.
Tapping into Your CI/CD Pipeline
Your Continuous Integration and Continuous Deployment (CI/CD) pipeline is the final piece of the puzzle. It's the automated system that builds, tests, and deploys your code, making it the ultimate source for deployment and stability data.
Tools like Jenkins, GitHub Actions, or CircleCI log every single build and deployment attempt. By analyzing these logs, you can accurately track:
- Successful Deployments: This gives you a precise count for your Deployment Frequency metric.
- Failed Deployments: A deployment that gets rolled back or requires an immediate hotfix is a change failure. Tracking these is key to calculating your Change Failure Rate.
- Pipeline Duration: How long does it take for a change to get through testing and deployment? This data helps you spot bottlenecks in your automation.
A rock solid CI/CD setup is the backbone of reliable metric collection. If you're looking to strengthen your pipeline, our guide on the 10 continuous integration best practices that won't make you cry is a great place to start.
Real World Examples for a Modern Stack
Let's imagine a common tech stack: a Django backend, a Next.js frontend, and Celery for asynchronous tasks. You could create a simple script that queries the GitHub API for all PRs merged to main in the last week.
For each PR, you'd check the associated Jira ticket to see when it moved to "In Progress." Then, you'd check your CI/CD logs (say, from GitHub Actions) for the timestamp of the successful deployment tied to that merge. With just these three data points, you've calculated Lead Time for Changes for every feature shipped.
The key is to connect these disparate data sources. A commit is just a commit until you link it to a Jira ticket and a successful deployment. That's when it becomes part of a meaningful story about your development process.
How to Interpret Metrics Without Ruining Your Culture
Alright, this is where the rubber meets the road. You've put in the hard work to collect the data, but now comes the real test: how do you actually use these developer productivity metrics for good without accidentally creating a culture of fear?
This is the exact point where well intentioned programs can curdle into toxic surveillance.
Let me be crystal clear about the single biggest lesson here: never, ever use these metrics to stack rank individual developers. The moment you do, the game is over. Trust evaporates, and your team will immediately start optimizing for the numbers, not for what actually matters.
Trends Over Absolutes
The first rule of healthy metric interpretation is to focus on trends, not absolute numbers. A single data point is just noise; a trend tells a story.
Is your team's average Cycle Time slowly creeping up over the last few months? That's a fantastic conversation starter for a team retrospective. It sparks curiosity, not blame.
Instead of cornering someone with, "Why was this PR so slow?" you can frame it as, "Hey team, I've noticed our review times are getting longer across the board. What's getting in our way? Are our PRs getting too big?"
Your metrics dashboard should be treated like a weather report for your engineering system. It provides signals and patterns to help the team prepare and adapt, not a tool to judge individual raindrops.
This simple shift in approach transforms data from an accusation into a shared diagnostic tool. It invites the team to solve problems together, which is the entire point.
The Danger of Gaming the System
Let me tell you a quick story. Early in my career, a manager decided that Pull Request (PR) Count was the ultimate measure of productivity. The goal was simple: increase the number of PRs merged per developer each week.
What happened next was completely predictable.
The team started breaking every tiny change into a separate PR. A simple one line fix that should have been a single commit suddenly became three different pull requests: one to add a comment, one to make the change, and one to update a test. The PR count skyrocketed. Management was thrilled, but our actual delivery speed ground to a halt as the team drowned in a sea of trivial code reviews.
We learned a crucial lesson that day: what you measure is what you get. If you incentivize a simplistic output metric, your smart engineers will find the most efficient way to give you that number, even if it brings the whole system to its knees.
How to Have Constructive Conversations
Using data constructively is a skill. It's all about framing the information as a starting point for a collaborative discussion, not a final judgment.
Here are a few ways to foster healthy, data informed conversations:
- Bring Data to Retrospectives: Instead of relying only on feelings or memory, use trends from your dashboard to guide the conversation. "Our Change Failure Rate has been flat for a while. Any ideas on how we could improve our pre deployment testing?"
- Ask Open Ended Questions: Avoid leading questions that put people on the defensive. Instead of "Why are you shipping such large PRs?" try "What are the biggest obstacles to shipping smaller, more frequent changes?"
- Celebrate Improvements Collectively: When a metric improves like a significant drop in MTTR celebrate it as a team win. This reinforces that the goal is collective improvement, not individual performance.
By focusing on trends, staying vigilant for antipatterns, and framing conversations around shared goals, you can build a culture where metrics are seen as a helpful ally for continuous improvement not a tool for micromanagement.
Your Roadmap to Implementing Meaningful Metrics
Let's roll up our sleeves and turn all this theory into an actionable plan. This isn't a project you can just knock out in a week; think of it as a gradual cultural shift that needs patience and, most importantly, buy in from your team.
A phased approach is key. It stops the whole thing from feeling like metrics are being "done to them" and instead makes it a collaborative effort to improve how everyone works.
The goal here is to build trust, one step at a time. Jumping straight to automated dashboards can feel like a surprise audit nobody asked for. Instead, we want to build a shared understanding where everyone sees the value before the first chart is even created.
Phase 1: Start with a Conversation
Before you even think about tools or spreadsheets, just talk to your team. Seriously. The first step is purely about getting qualitative feedback. Find some time during a retrospective to chat about pain points, but hold off on mentioning "dashboards" or "metrics" just yet.
Keep the questions open ended and genuine:
- "What parts of our development process feel slow or just plain frustrating?"
- "Where do you feel like you're getting blocked most often?"
- "If we could wave a magic wand and fix one thing about how we ship code, what would it be?"
Listen carefully. Document everything. This conversation gives you a qualitative baseline and ensures that whatever you decide to measure is tied to solving real problems the team is already feeling.
Phase 2: Manual Data Collection
Okay, now that you're armed with the team's feedback, pick just one or two metrics that directly address a major pain point they brought up. If everyone complained about how long code reviews take, maybe you start tracking Cycle Time or PR Review Time.
And here's the crucial part: don't automate anything yet.
For a couple of sprints, track this metric manually in a simple spreadsheet. Yes, it's tedious. But this step is vital. It forces you to get your hands dirty and really understand the nuances of the data. It also shows the team you're invested in the process, not just installing another tool and walking away.
Phase 3: Introduce Automation
Once you've been tracking a metric by hand for a few weeks and have discussed the initial findings, it's time to bring in the machines. This is where you can introduce a dedicated tool or build a simple script to pull data from your Git and Jira APIs.
Transparency is everything here. Explain to the team what you're automating and why, connecting it directly back to the frustrations you all talked about in Phase 1. This step should feel like a relief ("thank god we don't have to update that spreadsheet anymore"), not an intrusion.
Phase 4: Share and Iterate
With your automated data flowing, present the first few trends to the team. Frame it as nothing more than a starting point for another conversation. Show the data, share what you think it might mean, and then ask the most important question of all: "Does this actually match your experience?"
Use their feedback to refine your approach. Maybe the data is misleading, or perhaps it highlights a completely different problem you hadn't considered. This loop collect, share, discuss, and refine is the absolute heart of a healthy metrics culture. It's a continuous process that strengthens the engineering org, much like you'd build out a technical roadmap template that actually works.
A Few Common Questions About Developer Metrics
Diving into developer metrics can feel like walking a tightrope. It's only natural to have questions about how to use these ideas in the real world without tripping up your team's culture. Let's tackle some of the most common ones I hear from engineering leaders.
How Do You Measure Productivity for Non Coding Tasks?
This is a fantastic question because so much of an engineer's day things like research spikes, system design, or mentoring doesn't end in a pull request. The trick is to stop thinking about code output and start focusing on valuable outcomes.
Instead of a PR, the deliverable might be:
- A crisp design document that clarifies a complex feature.
- A research summary that de risks a technical approach.
- A scrappy proof of concept that proves an idea is viable.
The goal is always to track progress toward a team objective. Answering a critical question that unblocks the team is immensely productive, even if it generates zero lines of code.
What Is the Difference Between Cycle Time and Lead Time?
It's easy to get these two mixed up, but they tell you completely different stories about your process. The distinction is crucial for finding where your real bottlenecks are.
Think of it this way: Lead Time is the whole journey from the customer's perspective. It starts the moment a request is made and ends only when that feature is live and in their hands. It's the "customer view" of your delivery pipeline.
Cycle Time, on the other hand, is the "developer view." It kicks off the moment a developer starts active work (think: first commit) and stops when the code is deployed. A massive gap between your Lead Time and Cycle Time is a huge red flag that work is getting stuck before a developer even touches it often in slow planning or prioritization meetings.
A healthy engineering culture is always asking, "How can we shrink both?" Shrinking Cycle Time makes your development workflow more efficient. Shrinking Lead Time improves the entire value stream, from idea to impact.
How Often Should Our Team Review These Metrics?
The rhythm of your review is just as important as the metrics themselves. You're aiming for continuous improvement, not creating a culture of daily performance anxiety.
A great place to start is by looking at key trends, like Cycle Time and Deployment Frequency, during your team's regular retrospectives maybe every two weeks. That cadence is perfect for spotting patterns and sparking conversations about how to get better, all without getting lost in the noise of daily fluctuations.
If you're an engineering leader at a startup trying to build a high performing team with a healthy, data informed culture, you don't have to go it alone. As a consultant, Kuldeep Pisda specializes in helping companies accelerate their roadmaps and build robust systems without cutting corners on quality. Let's connect and discuss how to strengthen your engineering foundations.
Subscribe to our newsletter.
Become a subscriber receive the latest updates in your inbox.

Member discussion